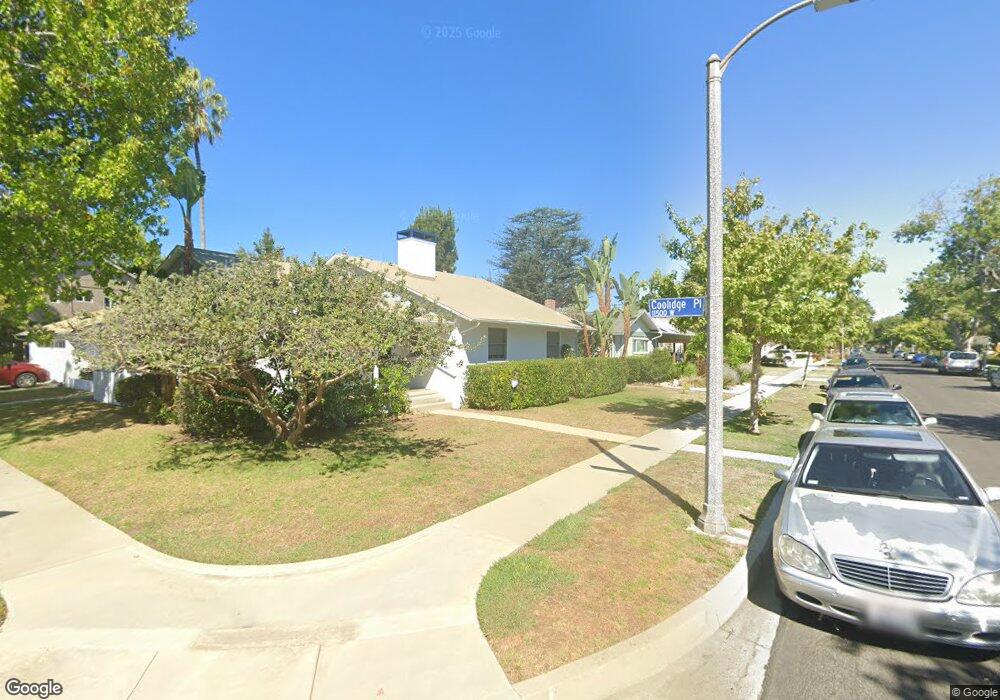
3243 Coolidge Ave Los Angeles, CA 90066
Mar Vista NeighborhoodEstimated Value: $2,785,000 - $3,068,000
4
Beds
3
Baths
2,443
Sq Ft
$1,192/Sq Ft
Est. Value
About This Home
This home is located at 3243 Coolidge Ave, Los Angeles, CA 90066 and is currently estimated at $2,911,969, approximately $1,191 per square foot. 3243 Coolidge Ave is a home located in Los Angeles County with nearby schools including Mar Vista Elementary, Daniel Webster Middle School, and Venice High School.
Ownership History
Date
Name
Owned For
Owner Type
Purchase Details
Closed on
Jan 30, 2020
Sold by
Chen Lee Wen Su
Bought by
Chen Lee Wen
Current Estimated Value
Purchase Details
Closed on
Jan 29, 2020
Sold by
Chen Lee Wen Su
Bought by
Chen Lee Wen Su
Purchase Details
Closed on
May 2, 2011
Sold by
Chen So Yeng and Chen Lee Wen
Bought by
Chen So Yeng and Chen Lee Wen Su
Purchase Details
Closed on
Jan 23, 2002
Sold by
Chen So Yeng and Chen Lee Wen
Bought by
Chen So Yeng
Home Financials for this Owner
Home Financials are based on the most recent Mortgage that was taken out on this home.
Original Mortgage
$167,000
Interest Rate
7.11%
Purchase Details
Closed on
Nov 20, 2001
Sold by
Chen So Yeng and Chen Lee Wen S
Bought by
Chen So Yeng
Create a Home Valuation Report for This Property
The Home Valuation Report is an in-depth analysis detailing your home's value as well as a comparison with similar homes in the area
Home Values in the Area
Average Home Value in this Area
Purchase History
| Date | Buyer | Sale Price | Title Company |
|---|---|---|---|
| Chen Lee Wen | -- | None Available | |
| Chen Lee Wen Su | -- | None Available | |
| Chen Lee Wen Su | -- | None Available | |
| Chen So Yeng | -- | None Available | |
| Chen So Yeng | -- | Ticor Title | |
| Chen So Yeng | -- | -- |
Source: Public Records
Mortgage History
| Date | Status | Borrower | Loan Amount |
|---|---|---|---|
| Previous Owner | Chen So Yeng | $167,000 |
Source: Public Records
Tax History Compared to Growth
Tax History
| Year | Tax Paid | Tax Assessment Tax Assessment Total Assessment is a certain percentage of the fair market value that is determined by local assessors to be the total taxable value of land and additions on the property. | Land | Improvement |
|---|---|---|---|---|
| 2025 | $7,374 | $597,822 | $327,616 | $270,206 |
| 2024 | $7,374 | $586,101 | $321,193 | $264,908 |
| 2023 | $7,238 | $574,610 | $314,896 | $259,714 |
| 2022 | $6,913 | $563,344 | $308,722 | $254,622 |
| 2021 | $6,815 | $552,299 | $302,669 | $249,630 |
| 2020 | $6,880 | $546,637 | $299,566 | $247,071 |
| 2019 | $6,615 | $535,920 | $293,693 | $242,227 |
| 2018 | $6,497 | $525,413 | $287,935 | $237,478 |
| 2016 | $6,196 | $505,012 | $276,755 | $228,257 |
| 2015 | $6,106 | $497,427 | $272,598 | $224,829 |
| 2014 | $6,132 | $487,684 | $267,259 | $220,425 |
Source: Public Records
Map
Nearby Homes
- 11500 Kingsland St
- 3218 S Barrington Ave
- 3230 S Barrington Ave
- 3238 Corinth Ave
- 3021 Barry Ave
- 11600 National Blvd
- 11428 National Blvd Unit 101
- 3134 Granville Ave
- 11931 Lawler St
- 11516 Clarkson Rd
- 11523 Vienna Way
- 3491 Butler Ave
- 12118 Navy St
- 3300 S Sepulveda Blvd Unit L27
- 11120 Queensland St Unit H57
- 11121 Queensland St Unit A3
- 2884 Sawtelle Blvd Unit 215
- 3166 S Sepulveda Blvd Unit 22
- 2852 Sawtelle Blvd Unit 41
- 11286 Westminster Ave Unit 101
- 3237 Coolidge Ave
- 3249 Coolidge Ave
- 3231 Coolidge Ave
- 11541 Coolidge Place
- 3230 Federal Ave
- 3226 Federal Ave
- 3242 Coolidge Ave
- 3225 Coolidge Ave
- 3248 Coolidge Ave
- 3236 Coolidge Ave
- 3232 Federal Ave
- 3261 Coolidge Ave
- 3220 Federal Ave
- 3254 Coolidge Ave
- 3230 Coolidge Ave
- 11547 Coolidge Place
- 3236 Federal Ave
- 3219 Coolidge Ave
- 11540 Coolidge Place
- 3260 Coolidge Ave