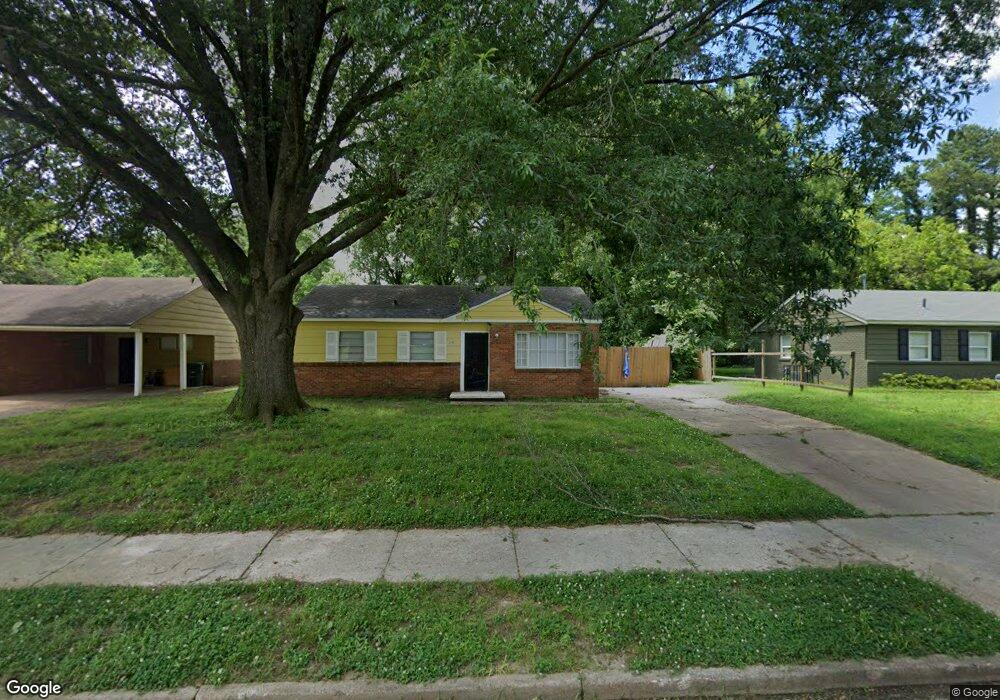
3245 Madewell St Memphis, TN 38127
Frayser NeighborhoodEstimated Value: $99,000 - $109,927
3
Beds
1
Bath
991
Sq Ft
$105/Sq Ft
Est. Value
About This Home
This home is located at 3245 Madewell St, Memphis, TN 38127 and is currently estimated at $103,732, approximately $104 per square foot. 3245 Madewell St is a home located in Shelby County with nearby schools including Whitney Achievement Elementary School, Grandview Heights Middle, and Trezevant High School.
Ownership History
Date
Name
Owned For
Owner Type
Purchase Details
Closed on
Sep 8, 2021
Sold by
Mid South Homebuyers
Bought by
Vesce Christine
Current Estimated Value
Purchase Details
Closed on
Mar 17, 2021
Sold by
Parker Jeremy
Bought by
Mid South Homebuyers Gp
Purchase Details
Closed on
Jan 3, 2008
Sold by
Arlington Road Llc
Bought by
Parker Jeremy
Home Financials for this Owner
Home Financials are based on the most recent Mortgage that was taken out on this home.
Original Mortgage
$50,400
Interest Rate
6.15%
Mortgage Type
Purchase Money Mortgage
Purchase Details
Closed on
Feb 9, 2007
Sold by
Haley John
Bought by
Arlington Road Llc
Purchase Details
Closed on
Mar 28, 1997
Sold by
Fitzgerald William and Fitzgerald Patricia A
Bought by
Haley John
Purchase Details
Closed on
Apr 2, 1996
Bought by
Christ Temple Holiness Chu
Create a Home Valuation Report for This Property
The Home Valuation Report is an in-depth analysis detailing your home's value as well as a comparison with similar homes in the area
Home Values in the Area
Average Home Value in this Area
Purchase History
| Date | Buyer | Sale Price | Title Company |
|---|---|---|---|
| Vesce Christine | $100,500 | Saddle Creek Title Llc | |
| Mid South Homebuyers Gp | $17,500 | Saddle Creek Title Llc | |
| Parker Jeremy | $63,000 | Title Assurance & Escrow Inc | |
| Arlington Road Llc | -- | None Available | |
| Haley John | $33,500 | Stewart Title Company | |
| Christ Temple Holiness Chu | $19,228 | -- |
Source: Public Records
Mortgage History
| Date | Status | Borrower | Loan Amount |
|---|---|---|---|
| Previous Owner | Parker Jeremy | $50,400 | |
| Closed | Mid South Homebuyers Gp | $0 |
Source: Public Records
Tax History Compared to Growth
Tax History
| Year | Tax Paid | Tax Assessment Tax Assessment Total Assessment is a certain percentage of the fair market value that is determined by local assessors to be the total taxable value of land and additions on the property. | Land | Improvement |
|---|---|---|---|---|
| 2025 | $543 | $25,550 | $1,875 | $23,675 |
| 2024 | $543 | $16,025 | $1,550 | $14,475 |
| 2023 | $976 | $16,025 | $1,550 | $14,475 |
| 2022 | $976 | $16,025 | $1,550 | $14,475 |
| 2021 | $713 | $9,850 | $1,550 | $8,300 |
| 2020 | $370 | $5,100 | $1,550 | $3,550 |
| 2019 | $163 | $5,100 | $1,550 | $3,550 |
| 2018 | $86 | $2,675 | $1,550 | $1,125 |
| 2017 | $88 | $2,675 | $1,550 | $1,125 |
| 2016 | $423 | $9,675 | $0 | $0 |
| 2014 | $423 | $9,675 | $0 | $0 |
Source: Public Records
Map
Nearby Homes
- 3296 Madewell St
- 1142 Frayser Blvd
- 3127 Dahlia Dr
- 3267 Millington Rd
- 1104 Saunders Ave
- 1033 Cindy Ln
- 1337 Haywood Ave
- 1391 Haywood Ave
- 1013 Par Ave
- 3430 Shiloh Dr
- 942 Frayser Cir
- 991 Joel Ave
- 1304 Pera Dr
- 994 Joel Ave
- 951 Joel Ave
- 974 Joel Ave
- 3551 Millington Rd
- 1343 Dove St
- 3590 Thomas St
- 3531 Randolph St
- 3251 Madewell St
- 3239 Madewell St
- 3257 Madewell St
- 3233 Madewell St
- 3263 Madewell St
- 3227 Madewell St
- 3240 Madewell St
- 3248 Madewell St
- 3254 Madewell St
- 3269 Madewell St
- 3221 Madewell St
- 3264 Madewell St
- 3275 Madewell St
- 1202 Canfield Ave
- 3224 Madewell St
- 3215 Madewell St
- 1214 Canfield Ave
- 1221 Madewell Cove
- 3209 Madewell St
- 1195 Canfield Ave