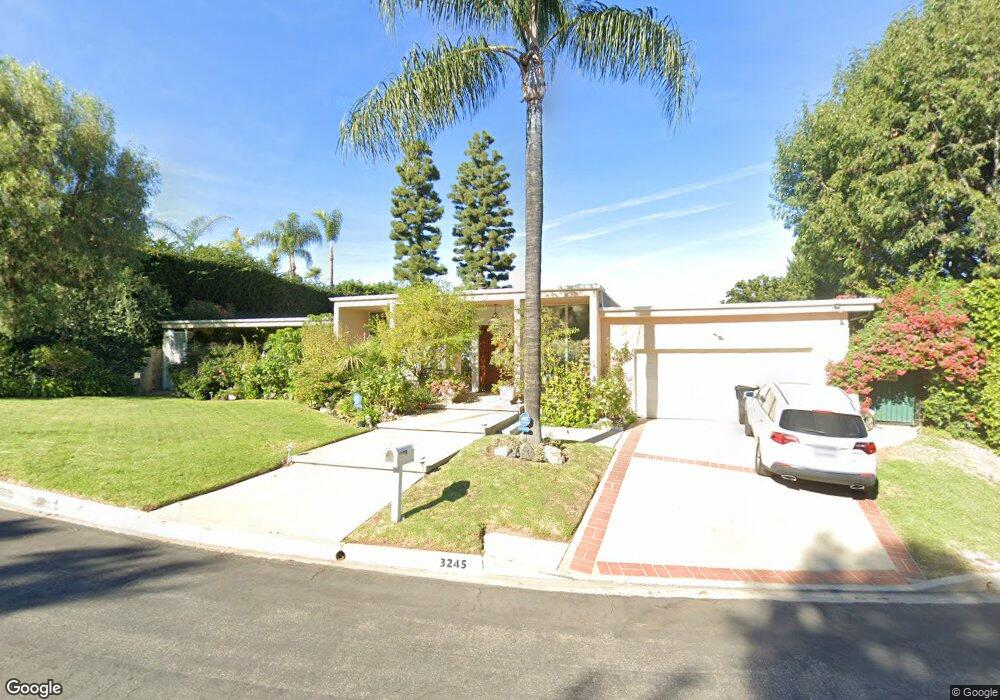
3245 Steven Dr Encino, CA 91436
Estimated Value: $2,130,045 - $3,120,000
4
Beds
3
Baths
3,312
Sq Ft
$810/Sq Ft
Est. Value
About This Home
This home is located at 3245 Steven Dr, Encino, CA 91436 and is currently estimated at $2,683,261, approximately $810 per square foot. 3245 Steven Dr is a home located in Los Angeles County with nearby schools including Lanai Road Elementary, William Mulholland Middle, and Hesby Oaks Elementary School.
Ownership History
Date
Name
Owned For
Owner Type
Purchase Details
Closed on
Dec 23, 2011
Sold by
Weisenberg Gary and Weisenberg Sharon
Bought by
Weisenberg Gary and Weisenberg Sharon
Current Estimated Value
Home Financials for this Owner
Home Financials are based on the most recent Mortgage that was taken out on this home.
Original Mortgage
$415,000
Interest Rate
3.62%
Mortgage Type
New Conventional
Purchase Details
Closed on
Dec 18, 2007
Sold by
Weisenberg Gary J and Weisenberg Sharon I
Bought by
Weisenberg Gary and Weisenberg Sharon
Purchase Details
Closed on
Oct 14, 2002
Sold by
Weisenberg Gary J
Bought by
Weisenberg Gary J and Weisenberg Sharon I
Home Financials for this Owner
Home Financials are based on the most recent Mortgage that was taken out on this home.
Original Mortgage
$360,000
Interest Rate
6.05%
Create a Home Valuation Report for This Property
The Home Valuation Report is an in-depth analysis detailing your home's value as well as a comparison with similar homes in the area
Home Values in the Area
Average Home Value in this Area
Purchase History
| Date | Buyer | Sale Price | Title Company |
|---|---|---|---|
| Weisenberg Gary | -- | Lsi | |
| Weisenberg Gary | -- | None Available | |
| Weisenberg Gary J | -- | First American Title Co | |
| Weisenberg Gary J | -- | First American Title Co |
Source: Public Records
Mortgage History
| Date | Status | Borrower | Loan Amount |
|---|---|---|---|
| Closed | Weisenberg Gary | $415,000 | |
| Closed | Weisenberg Gary J | $360,000 |
Source: Public Records
Tax History
| Year | Tax Paid | Tax Assessment Tax Assessment Total Assessment is a certain percentage of the fair market value that is determined by local assessors to be the total taxable value of land and additions on the property. | Land | Improvement |
|---|---|---|---|---|
| 2025 | $10,394 | $829,744 | $414,872 | $414,872 |
| 2024 | $10,394 | $813,476 | $406,738 | $406,738 |
| 2023 | $10,200 | $797,526 | $398,763 | $398,763 |
| 2022 | $9,761 | $781,890 | $390,945 | $390,945 |
| 2021 | $9,631 | $766,560 | $383,280 | $383,280 |
| 2019 | $9,352 | $743,824 | $371,912 | $371,912 |
| 2018 | $9,221 | $729,240 | $364,620 | $364,620 |
| 2016 | $8,785 | $700,924 | $350,462 | $350,462 |
| 2015 | $8,661 | $690,396 | $345,198 | $345,198 |
| 2014 | $8,695 | $676,874 | $338,437 | $338,437 |
Source: Public Records
Map
Nearby Homes
- 3300 Red Rose Dr
- 3328 Red Rose Dr
- 16015 Jeanne Ln
- 16141 Bayberry Place
- 15936 Valley Wood Rd
- 16244 Dorilee Ln
- 3584 Sepulveda Blvd
- 15815 Castlewoods Dr
- 3701 Royal Meadow Rd
- 16230 Meadowcrest Rd
- 16187 Royal Oak Rd
- 3565 Crownridge Dr
- 15739 Mulholland Place
- 3465 Valley Meadow Rd
- 4210 N Sepulveda Blvd
- 15656 Crownridge Place
- 3690 Crownridge Dr
- 16167 Royal Oak Rd
- 16351 Sloan Dr
- 16366 Sloan Dr
- 3235 Steven Dr
- 3231 Steven Dr
- 3250 Steven Dr
- 3240 Steven Dr
- 15974 Tobin Way
- 15960 Tobin Way
- 3224 Steven Dr
- 3229 Steven Dr
- 15984 Tobin Way
- 3225 Steven Dr
- 15979 Tobin Way
- 16043 Sabana Ln
- 16009 Sabana Ln
- 16003 Sabana Ln
- 16005 Sabana Ln
- 15969 Tobin Way
- 3215 Steven Dr
- 15959 Tobin Way
- 16053 Sabana Ln
- 16033 Sabana Ln
Your Personal Tour Guide
Ask me questions while you tour the home.