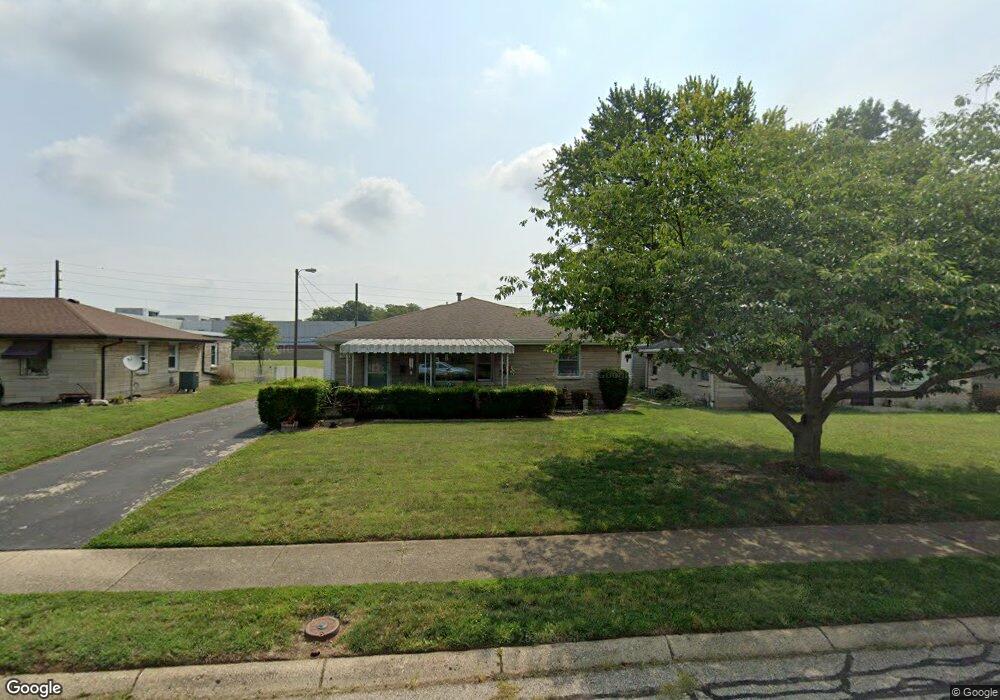
325 Coovert St Columbus, IN 47201
Estimated Value: $170,000 - $223,840
2
Beds
2
Baths
1,973
Sq Ft
$99/Sq Ft
Est. Value
About This Home
This home is located at 325 Coovert St, Columbus, IN 47201 and is currently estimated at $194,460, approximately $98 per square foot. 325 Coovert St is a home located in Bartholomew County with nearby schools including Clifty Creek Elementary School, Central Middle School, and Columbus East High School.
Ownership History
Date
Name
Owned For
Owner Type
Purchase Details
Closed on
Apr 26, 2016
Sold by
Martin Georgia E
Bought by
Martin Georgia E and Martin Allen Ray
Current Estimated Value
Purchase Details
Closed on
Mar 6, 2008
Sold by
Secretary Housing Urban Development
Bought by
Martin Georgia E
Purchase Details
Closed on
Sep 20, 2007
Sold by
Citimortgage Inc
Bought by
Housing & Urban Development
Purchase Details
Closed on
Aug 14, 2007
Sold by
Sheriff Of Bartholomew County
Bought by
Citimortgage Inc
Purchase Details
Closed on
Apr 25, 2005
Sold by
Barnett Donald T and Barnett Barbara J
Bought by
Hancher Chad A and Lunsford Nickole M
Purchase Details
Closed on
Sep 2, 2003
Sold by
Gene Eddy
Bought by
Barnett Donald T and Barnett Barbara J
Create a Home Valuation Report for This Property
The Home Valuation Report is an in-depth analysis detailing your home's value as well as a comparison with similar homes in the area
Home Values in the Area
Average Home Value in this Area
Purchase History
| Date | Buyer | Sale Price | Title Company |
|---|---|---|---|
| Martin Georgia E | -- | Attorney | |
| Martin Georgia E | -- | None Available | |
| Housing & Urban Development | -- | Attorney | |
| Citimortgage Inc | $100,511 | Attorney | |
| Hancher Chad A | -- | Midwest Title Corporation | |
| Barnett Donald T | -- | -- |
Source: Public Records
Mortgage History
| Date | Status | Borrower | Loan Amount |
|---|---|---|---|
| Closed | Citimortgage Inc | $0 |
Source: Public Records
Tax History Compared to Growth
Tax History
| Year | Tax Paid | Tax Assessment Tax Assessment Total Assessment is a certain percentage of the fair market value that is determined by local assessors to be the total taxable value of land and additions on the property. | Land | Improvement |
|---|---|---|---|---|
| 2024 | $1,438 | $190,900 | $25,900 | $165,000 |
| 2023 | $1,409 | $185,500 | $25,900 | $159,600 |
| 2022 | $1,382 | $185,400 | $25,900 | $159,500 |
| 2021 | $1,355 | $142,600 | $14,600 | $128,000 |
| 2020 | $504 | $92,600 | $14,600 | $78,000 |
| 2019 | $472 | $92,600 | $14,600 | $78,000 |
| 2018 | $419 | $89,600 | $14,600 | $75,000 |
| 2017 | $360 | $90,500 | $13,700 | $76,800 |
| 2016 | $302 | $87,400 | $13,700 | $73,700 |
| 2014 | $378 | $91,500 | $13,700 | $77,800 |
Source: Public Records
Map
Nearby Homes
- 2905 Kentucky Ave
- 51 S Brooks St
- 2651 Clifty St
- 757 Fairview Dr
- 41 N Ross St
- 729 Glendale Dr
- 41 N Cherry St
- 2263 Wallace Ave
- 2032 Indiana Ave
- 213 Hege Ave
- 507 N Cherry St
- 2041 Mckinley Ave
- 342 Jones St
- 661 Smith St
- 1631 Kentucky Ave
- 212 S Beatty St
- 2921 10th St
- 52 N Hinman St
- 1521 Indiana Ave
- 758 N Cherry St