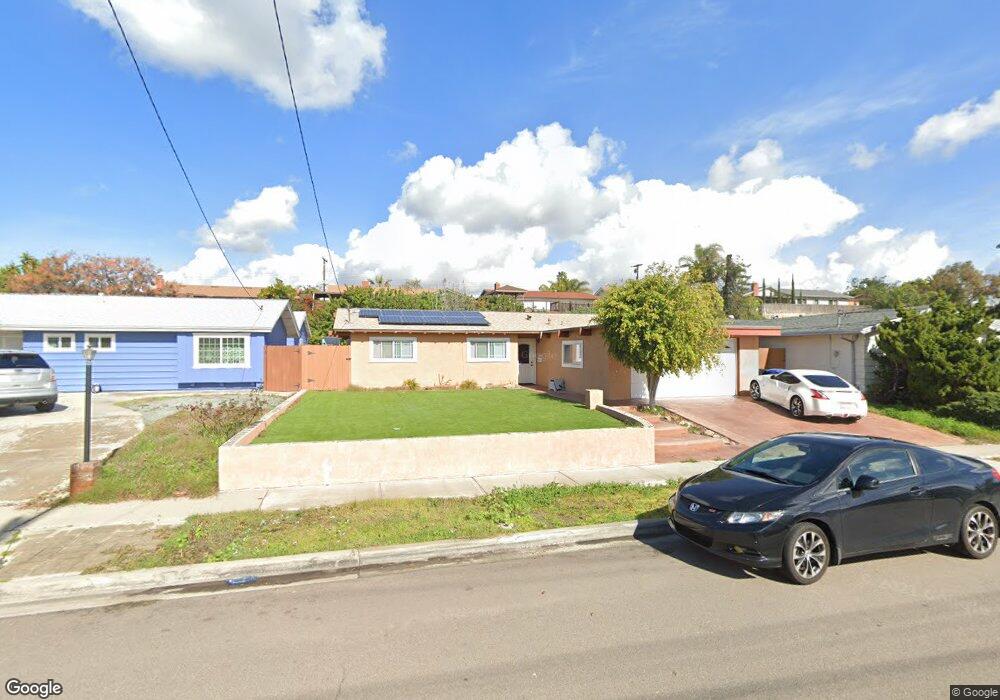
325 E Moss St Chula Vista, CA 91911
Castle Park NeighborhoodEstimated Value: $738,000 - $927,000
4
Beds
4
Baths
2,001
Sq Ft
$435/Sq Ft
Est. Value
About This Home
This home is located at 325 E Moss St, Chula Vista, CA 91911 and is currently estimated at $869,505, approximately $434 per square foot. 325 E Moss St is a home located in San Diego County with nearby schools including Karl H Kellogg Elementary School, Hilltop Middle School, and Hilltop Senior High School.
Ownership History
Date
Name
Owned For
Owner Type
Purchase Details
Closed on
Apr 9, 1999
Sold by
Inman Linda D
Bought by
Garcia Orlando and Garcia Ghisela
Current Estimated Value
Home Financials for this Owner
Home Financials are based on the most recent Mortgage that was taken out on this home.
Original Mortgage
$178,500
Outstanding Balance
$44,974
Interest Rate
6.98%
Mortgage Type
VA
Estimated Equity
$824,531
Create a Home Valuation Report for This Property
The Home Valuation Report is an in-depth analysis detailing your home's value as well as a comparison with similar homes in the area
Home Values in the Area
Average Home Value in this Area
Purchase History
| Date | Buyer | Sale Price | Title Company |
|---|---|---|---|
| Garcia Orlando | $180,000 | Commonwealth Land Title Co |
Source: Public Records
Mortgage History
| Date | Status | Borrower | Loan Amount |
|---|---|---|---|
| Open | Garcia Orlando | $178,500 |
Source: Public Records
Tax History
| Year | Tax Paid | Tax Assessment Tax Assessment Total Assessment is a certain percentage of the fair market value that is determined by local assessors to be the total taxable value of land and additions on the property. | Land | Improvement |
|---|---|---|---|---|
| 2025 | $2,138 | $356,754 | $108,158 | $248,596 |
| 2024 | $2,138 | $349,760 | $106,038 | $243,722 |
| 2023 | $2,171 | $342,903 | $103,959 | $238,944 |
| 2022 | $2,230 | $336,180 | $101,921 | $234,259 |
| 2021 | $1,744 | $294,981 | $99,923 | $195,058 |
| 2020 | $1,338 | $257,316 | $98,899 | $158,417 |
| 2019 | $1,474 | $252,271 | $96,960 | $155,311 |
| 2018 | $2,777 | $247,325 | $95,059 | $152,266 |
| 2017 | $2,717 | $242,477 | $93,196 | $149,281 |
| 2016 | $2,652 | $237,723 | $91,369 | $146,354 |
| 2015 | $2,613 | $234,153 | $89,997 | $144,156 |
| 2014 | $2,569 | $229,568 | $88,235 | $141,333 |
Source: Public Records
Map
Nearby Homes
- 939 Nolan Way
- 902 Monterey Ct
- 205 Camlau Dr Unit C
- 445 Montcalm St
- 476 Montclair St
- 71 E L St
- 1221 Melrose Ave
- 927 Agua Tibia Ave
- 1267 Melrose Ave
- 202 E J St
- 45 El Capitan Dr
- 466 Thrush St
- 161 E Palomar St
- 1228 Oleander Ave
- 1324 Park Dr
- 1268 Helix Ave
- 655 Robert Ave
- 607 E J St
- 1008 Calma Dr
- 0 Julian Estates Rd Ct Unit NP26049137
Your Personal Tour Guide
Ask me questions while you tour the home.