325 Ewers Rd Leslie, MI 49251
Estimated Value: $186,000 - $414,000
4
Beds
2
Baths
1,894
Sq Ft
$152/Sq Ft
Est. Value
About This Home
This home is located at 325 Ewers Rd, Leslie, MI 49251 and is currently estimated at $287,333, approximately $151 per square foot. 325 Ewers Rd is a home located in Ingham County with nearby schools including Dansville Elementary School, Dansville Middle School, and Dansville High School.
Create a Home Valuation Report for This Property
The Home Valuation Report is an in-depth analysis detailing your home's value as well as a comparison with similar homes in the area
Home Values in the Area
Average Home Value in this Area
Mortgage History
| Date | Status | Borrower | Loan Amount |
|---|---|---|---|
| Closed | Pulling James J | $0 | |
| Closed | Pulling Julie A | $15,000 | |
| Closed | Pulling James J | $235,400 | |
| Closed | Pulling James J | $42,603 | |
| Closed | Pulling James J | $24,000 | |
| Closed | Pulling James J | $200,600 | |
| Closed | Pulling James J | $12,127 | |
| Closed | Pulling James J | $172,000 | |
| Closed | Pulling James J | $140,000 | |
| Closed | Pulling James J | $45,500 | |
| Closed | Pulling James J | $24,334 |
Source: Public Records
Tax History Compared to Growth
Tax History
| Year | Tax Paid | Tax Assessment Tax Assessment Total Assessment is a certain percentage of the fair market value that is determined by local assessors to be the total taxable value of land and additions on the property. | Land | Improvement |
|---|---|---|---|---|
| 2024 | $3,937 | $159,350 | $49,700 | $109,650 |
| 2023 | $3,937 | $148,200 | $47,350 | $100,850 |
| 2022 | $3,701 | $139,000 | $47,350 | $91,650 |
| 2021 | $3,585 | $122,150 | $39,850 | $82,300 |
| 2020 | $3,533 | $115,000 | $36,700 | $78,300 |
| 2019 | $3,402 | $110,450 | $34,450 | $76,000 |
| 2018 | $3,421 | $95,450 | $32,800 | $62,650 |
| 2017 | $3,282 | $95,450 | $32,800 | $62,650 |
| 2016 | -- | $88,700 | $32,800 | $55,900 |
| 2015 | -- | $96,300 | $77,040 | $19,260 |
| 2014 | -- | $80,300 | $59,040 | $21,260 |
Source: Public Records
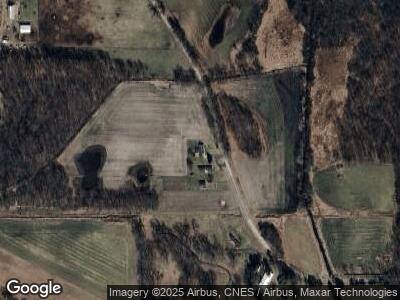
Map
Nearby Homes
- Lot 6 Sunset Ave
- Lot 8 7 Gables Rd
- Lot 5 Sunset Ave
- Lot 7 Sunset Ave
- 3037 Hawley Rd
- 3468 Haynes Rd
- 0 Decamp Rd
- 1675 Catholic Church Rd
- 4250 S Williams Rd
- 1414 Plains Rd
- Lot 4 E Dexter Trail
- Lot 3 E Dexter Trail
- 1082 Kinneville Rd
- 0 W Dansville Rd
- 4220 Wright Rd
- VL Hull Rd St
- 2185 W Barnes Rd
- 1455 E Fitchburg Rd
- 985 Ives Rd
- 1175 S Osborne Rd