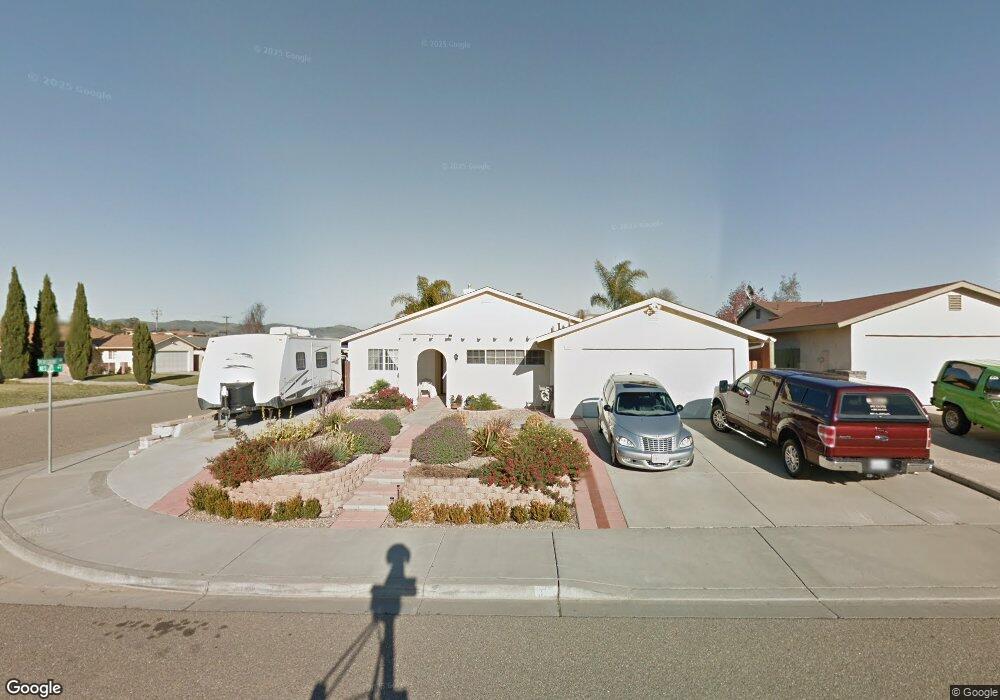
325 Kestrel Way Nipomo, CA 93444
Estimated Value: $691,000 - $758,000
3
Beds
2
Baths
1,488
Sq Ft
$479/Sq Ft
Est. Value
About This Home
This home is located at 325 Kestrel Way, Nipomo, CA 93444 and is currently estimated at $713,257, approximately $479 per square foot. 325 Kestrel Way is a home located in San Luis Obispo County with nearby schools including Dana Elementary School, Mesa Middle School, and Nipomo High School.
Ownership History
Date
Name
Owned For
Owner Type
Purchase Details
Closed on
Apr 15, 2024
Sold by
Mike And Carolyn Budd Family Trust and Budd Carolyn J
Bought by
Carolyn Budd Living Trust and Budd
Current Estimated Value
Purchase Details
Closed on
Apr 21, 2015
Sold by
Budd Michael G and Budd Carolyn J
Bought by
Mike & Carolyn Budd Family Trust and Budd Carolyn J
Purchase Details
Closed on
Feb 27, 2002
Sold by
Hernandez Aurelio M and Hernandez Rosa Ma
Bought by
Hernandez Aurelio M and Hernandez Rosa Maria
Purchase Details
Closed on
Apr 18, 1994
Sold by
Bonita Homes Inc
Bought by
Budd Michael G and Budd Carolyn J
Home Financials for this Owner
Home Financials are based on the most recent Mortgage that was taken out on this home.
Original Mortgage
$133,099
Interest Rate
8.73%
Mortgage Type
VA
Create a Home Valuation Report for This Property
The Home Valuation Report is an in-depth analysis detailing your home's value as well as a comparison with similar homes in the area
Home Values in the Area
Average Home Value in this Area
Purchase History
| Date | Buyer | Sale Price | Title Company |
|---|---|---|---|
| Carolyn Budd Living Trust | -- | None Listed On Document | |
| Mike & Carolyn Budd Family Trust | -- | Public | |
| Hernandez Aurelio M | -- | -- | |
| Budd Michael G | $140,000 | Cuesta Title Guaranty Compan |
Source: Public Records
Mortgage History
| Date | Status | Borrower | Loan Amount |
|---|---|---|---|
| Previous Owner | Budd Michael G | $133,099 |
Source: Public Records
Tax History Compared to Growth
Tax History
| Year | Tax Paid | Tax Assessment Tax Assessment Total Assessment is a certain percentage of the fair market value that is determined by local assessors to be the total taxable value of land and additions on the property. | Land | Improvement |
|---|---|---|---|---|
| 2025 | $2,815 | $279,100 | $100,763 | $178,337 |
| 2024 | $2,782 | $273,629 | $98,788 | $174,841 |
| 2023 | $2,782 | $268,264 | $96,851 | $171,413 |
| 2022 | $2,739 | $263,004 | $94,952 | $168,052 |
| 2021 | $2,732 | $257,848 | $93,091 | $164,757 |
| 2020 | $2,700 | $255,205 | $92,137 | $163,068 |
| 2019 | $2,682 | $250,202 | $90,331 | $159,871 |
| 2018 | $2,649 | $245,297 | $88,560 | $156,737 |
| 2017 | $2,598 | $240,488 | $86,824 | $153,664 |
| 2016 | $2,450 | $235,773 | $85,122 | $150,651 |
| 2015 | $2,414 | $232,233 | $83,844 | $148,389 |
| 2014 | $2,324 | $227,685 | $82,202 | $145,483 |
Source: Public Records
Map
Nearby Homes
- 483 Violet Ave
- 522 Higos Way
- Mesa Plan at Hill Street Terraces - Hill Street Series
- Pacific Plan at Hill Street Terraces - Hill Street Series
- Monarch Plan at Hill Street Terraces - Hill Street Series
- Rancho Plan at Hill Street Terraces - Hill Street Series
- Dana Plan at Hill Street Terraces - Hill Street Series
- 680 Hill St
- 719 W Tefft St
- 945 Jeanette Ln
- 109 Gardenia Way
- 426 Polaris Dr
- 368 Avenida de Amigos
- 759 Viola Ct
- 434 Jupiter Dr
- 393 Uranus Ct
- 525 Grande Ave Unit D
- 1180 Starlite Dr
- 468 Neptune Dr
- 205 Encino Ln
- 335 Kestrel Way
- 320 Black Hawk Way
- 330 Black Hawk Way
- 345 Kestrel Way
- 830 Peregrine Ln
- 820 Peregrine Ln
- 840 Peregrine Ln
- 340 Black Hawk Way
- 320 Kestrel Way
- 330 Kestrel Way
- 355 Kestrel Way
- 810 Peregrine Ln
- 340 Kestrel Way
- 350 Black Hawk Way
- 860 Peregrine Ln
- 365 Kestrel Way
- 350 Kestrel Way
- 875 Peregrine Ln
- 360 Black Hawk Way