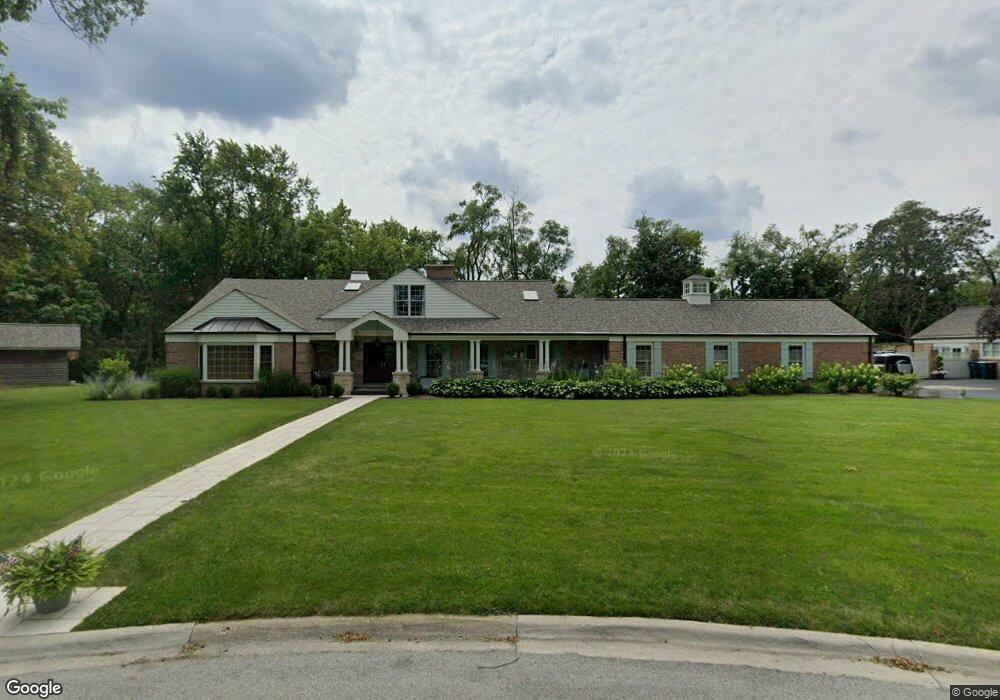
325 Pebblebrook Rd Northbrook, IL 60062
Estimated Value: $1,581,000 - $1,859,000
About This Home
This home is located at 325 Pebblebrook Rd, Northbrook, IL 60062 and is currently estimated at $1,738,800, approximately $409 per square foot. 325 Pebblebrook Rd is a home located in Cook County with nearby schools including Middlefork Primary School, Sunset Ridge Elementary School, and New Trier Township High School - Northfield.
Ownership History
We collect this data history from publicly available records. To have your information removed, we recommend requesting removal directly through your county’s website.
Purchase Details
Home Financials for this Owner
Home Financials are based on the most recent Mortgage that was taken out on this home.Purchase Details
Home Financials for this Owner
Home Financials are based on the most recent Mortgage that was taken out on this home.Purchase Details
Home Values in the Area
Average Home Value in this Area
Purchase History
We collect this data history from publicly available records. To have your information removed, we recommend requesting removal directly through your county’s website.
| Date | Buyer | Sale Price | Title Company |
|---|---|---|---|
| $1,200,000 | Ct | ||
| $1,580,000 | Cti | ||
| $765,500 | -- |
Mortgage History
We collect this data history from publicly available records. To have your information removed, we recommend requesting removal directly through your county’s website.
| Date | Status | Borrower | Loan Amount |
|---|---|---|---|
| Closed | $635,084 | ||
| Previous Owner | $580,000 |
Tax History
We collect this data history from publicly available records. To have your information removed, we recommend requesting removal directly through your county’s website.
| Year | Tax Paid | Tax Assessment Tax Assessment Total Assessment is a certain percentage of the fair market value that is determined by local assessors to be the total taxable value of land and additions on the property. | Land | Improvement |
|---|---|---|---|---|
| 2025 | $24,308 | $151,000 | $44,045 | $106,955 |
| 2024 | $24,308 | $117,000 | $37,753 | $79,247 |
| 2023 | $23,198 | $117,000 | $37,753 | $79,247 |
| 2022 | $23,198 | $117,000 | $37,753 | $79,247 |
| 2021 | $16,484 | $71,611 | $29,363 | $42,248 |
| 2020 | $16,231 | $71,611 | $29,363 | $42,248 |
| 2019 | $18,335 | $89,670 | $29,363 | $60,307 |
| 2018 | $19,405 | $90,395 | $25,168 | $65,227 |
| 2017 | $18,838 | $90,395 | $25,168 | $65,227 |
| 2016 | $18,541 | $93,830 | $25,168 | $68,662 |
| 2015 | $18,489 | $85,522 | $20,974 | $64,548 |
| 2014 | $18,043 | $85,522 | $20,974 | $64,548 |
| 2013 | $17,305 | $85,522 | $20,974 | $64,548 |
Map
- 1930 Sunset Ridge Rd
- 405 Voltz Rd
- 1975 Sunset Ridge Rd
- 253 Summerfield Rd
- 334 Southgate Dr
- 898 Bridlegate Ln
- 2 Bridlewood Rd
- 220 Shadowood Ln
- 310 Chipili Dr
- 24 Bridlewood Rd
- 30 Bridlewood Rd
- 2148 Royal Ridge Dr
- 1112 Whitfield Rd
- 1540 Grant Rd
- 947 Kensington Dr Unit 7E3
- 2240 Washington Dr
- 1002 Kensington Dr Unit 17E1
- 586 Earl Dr
- 1025 Longaker Rd
- 2220 Founders Dr Unit 213
- 1845 Sunset Ridge Rd
- 315 Pebblebrook Rd
- 1805 Sunset Ridge Rd
- 300 Pebblebrook Rd
- 1851 Sunset Ridge Rd
- 1805 Sunset Ridge Rd
- 320 Pebblebrook Rd
- 1881 Sunset Ridge Rd
- 1851 Sunset Ridge Rd
- 417 Pebblebrook Rd
- 360 Riverdale Dr
- 414 Pebblebrook Rd
- 365 Riverdale Dr
- 345 Sunset Ct
- 1925 Sunset Ridge Rd
- 1780 Sunset Ridge Rd
- 405 Valley Way
- 236 Summerfield Rd
- 380 Meadowbrook Dr
- 380 Meadowbrook Dr
Ask me questions while you tour the home.