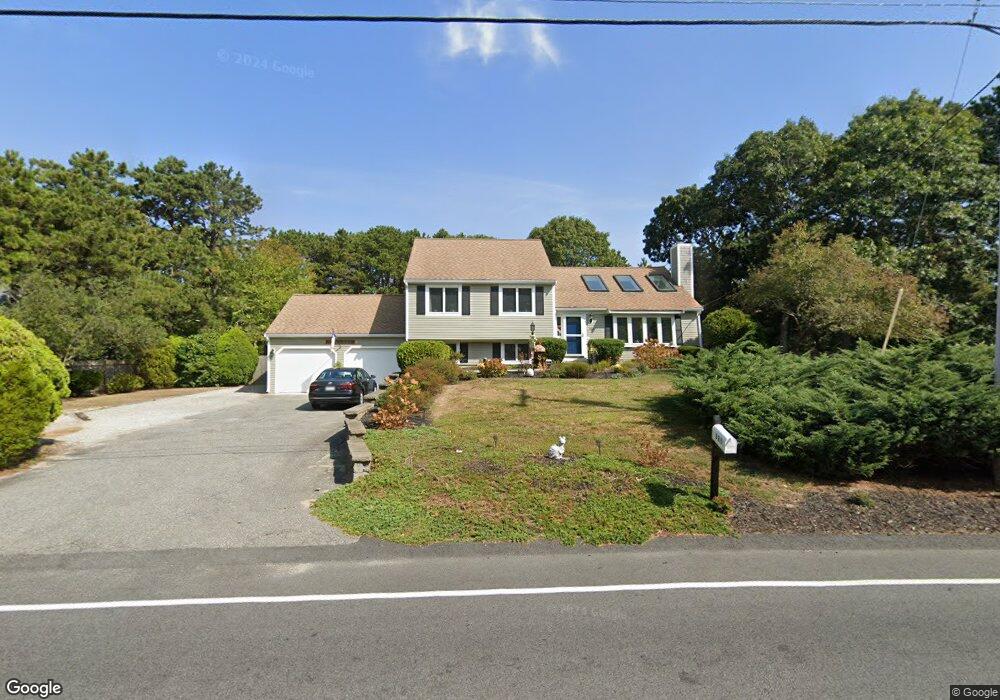
325 Red Brook Rd Mashpee, MA 02649
Seabrook NeighborhoodEstimated Value: $594,000 - $680,000
3
Beds
2
Baths
1,304
Sq Ft
$487/Sq Ft
Est. Value
About This Home
This home is located at 325 Red Brook Rd, Mashpee, MA 02649 and is currently estimated at $635,187, approximately $487 per square foot. 325 Red Brook Rd is a home located in Barnstable County with nearby schools including Kenneth C. Coombs School, Quashnet School, and Mashpee Middle School.
Ownership History
Date
Name
Owned For
Owner Type
Purchase Details
Closed on
Feb 18, 1999
Sold by
Sandsbury Michele
Bought by
Mallard Thomas
Current Estimated Value
Purchase Details
Closed on
Jul 23, 1993
Sold by
Fdic
Bought by
Mallard Thomas P
Purchase Details
Closed on
May 14, 1993
Sold by
Robinson Albert J and Robinson Valerie M
Bought by
Fdic
Create a Home Valuation Report for This Property
The Home Valuation Report is an in-depth analysis detailing your home's value as well as a comparison with similar homes in the area
Home Values in the Area
Average Home Value in this Area
Purchase History
| Date | Buyer | Sale Price | Title Company |
|---|---|---|---|
| Mallard Thomas | $35,000 | -- | |
| Mallard Thomas | $35,000 | -- | |
| Mallard Thomas P | $87,750 | -- | |
| Fdic | $85,000 | -- |
Source: Public Records
Tax History
| Year | Tax Paid | Tax Assessment Tax Assessment Total Assessment is a certain percentage of the fair market value that is determined by local assessors to be the total taxable value of land and additions on the property. | Land | Improvement |
|---|---|---|---|---|
| 2025 | $3,807 | $575,100 | $198,400 | $376,700 |
| 2024 | $3,468 | $539,400 | $180,400 | $359,000 |
| 2023 | $3,269 | $466,300 | $171,800 | $294,500 |
| 2022 | $3,017 | $369,300 | $139,700 | $229,600 |
| 2021 | $2,938 | $323,900 | $125,800 | $198,100 |
| 2020 | $2,857 | $314,300 | $121,000 | $193,300 |
| 2019 | $2,717 | $300,200 | $121,000 | $179,200 |
| 2018 | $2,456 | $275,300 | $121,000 | $154,300 |
| 2017 | $2,397 | $260,800 | $121,000 | $139,800 |
| 2016 | $2,318 | $250,900 | $121,000 | $129,900 |
| 2015 | $2,221 | $243,800 | $121,000 | $122,800 |
| 2014 | $2,273 | $242,100 | $119,500 | $122,600 |
Source: Public Records
Map
Nearby Homes
- 240 Surf Dr
- 61 Wintergreen Rd
- 12 Wintergreen Rd
- 35 Bayshore Dr
- 7 Sandy Way
- 42 Overlook Cir
- 29 Carl Landi Cir
- 89 Degrass Rd
- 9 Point Rd
- 197 Monomoscoy Rd
- 17 Degrass Rd
- 11 Rosewood Cir
- 49 Four Seasons Dr
- 36 Rosewood Cir
- 36 Carriage Shop Rd
- 381 Great Oak Rd Unit 9
- 42 Fells Pond Rd
- 21 Saltwater Cir
- 14 Azalea Ln
- 56 Carriage Shop Rd Unit 4
Your Personal Tour Guide
Ask me questions while you tour the home.