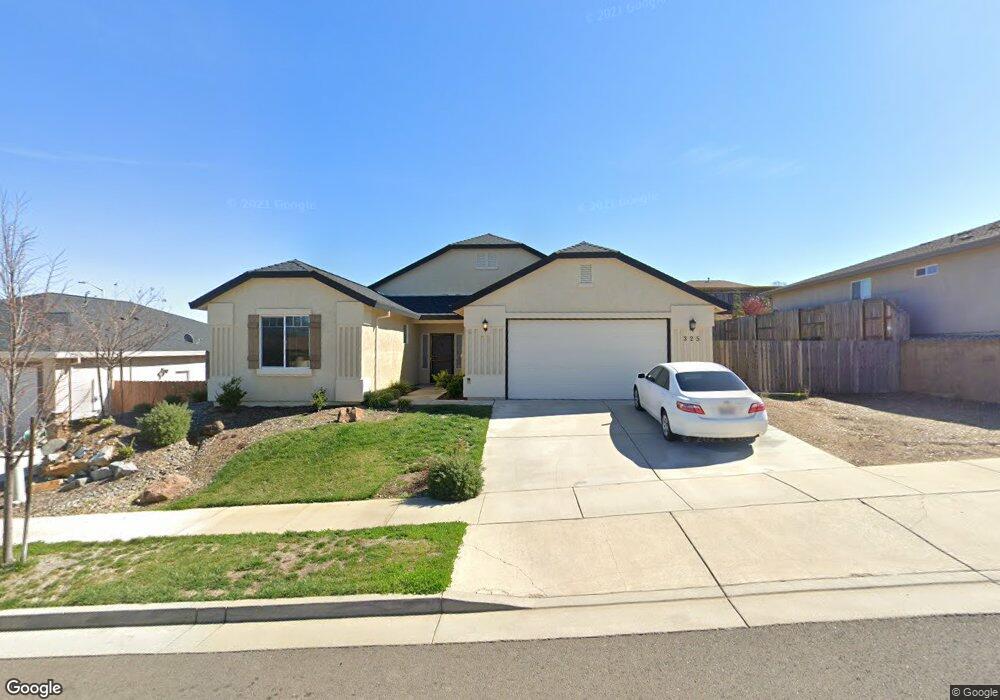
325 Stinson Loop Redding, CA 96003
Tanglewood NeighborhoodEstimated Value: $568,512 - $616,000
5
Beds
3
Baths
2,375
Sq Ft
$246/Sq Ft
Est. Value
About This Home
This home is located at 325 Stinson Loop, Redding, CA 96003 and is currently estimated at $584,878, approximately $246 per square foot. 325 Stinson Loop is a home with nearby schools including Boulder Creek Elementary School, Enterprise High School, and Country Christian School.
Ownership History
Date
Name
Owned For
Owner Type
Purchase Details
Closed on
Dec 21, 2020
Sold by
S & J Development Inc
Bought by
Buchanan Brandon and Buchanan Kristen
Current Estimated Value
Home Financials for this Owner
Home Financials are based on the most recent Mortgage that was taken out on this home.
Original Mortgage
$336,792
Outstanding Balance
$299,845
Interest Rate
2.7%
Mortgage Type
FHA
Estimated Equity
$285,033
Purchase Details
Closed on
Sep 23, 2014
Sold by
J&S Highland Park Llc
Bought by
S&J Development Inc
Create a Home Valuation Report for This Property
The Home Valuation Report is an in-depth analysis detailing your home's value as well as a comparison with similar homes in the area
Home Values in the Area
Average Home Value in this Area
Purchase History
| Date | Buyer | Sale Price | Title Company |
|---|---|---|---|
| Buchanan Brandon | $425,000 | Placer Title Company | |
| S&J Development Inc | $520,000 | Placer Title Company |
Source: Public Records
Mortgage History
| Date | Status | Borrower | Loan Amount |
|---|---|---|---|
| Open | Buchanan Brandon | $336,792 |
Source: Public Records
Tax History
| Year | Tax Paid | Tax Assessment Tax Assessment Total Assessment is a certain percentage of the fair market value that is determined by local assessors to be the total taxable value of land and additions on the property. | Land | Improvement |
|---|---|---|---|---|
| 2025 | $5,880 | $514,153 | $70,357 | $443,796 |
| 2024 | $5,828 | $504,073 | $68,978 | $435,095 |
| 2023 | $5,828 | $494,190 | $67,626 | $426,564 |
| 2022 | $5,665 | $484,500 | $66,300 | $418,200 |
| 2021 | $4,393 | $376,033 | $61,065 | $314,968 |
| 2020 | $4,328 | $372,178 | $60,439 | $311,739 |
| 2019 | $4,240 | $364,881 | $59,254 | $305,627 |
| 2018 | $4,169 | $357,728 | $58,093 | $299,635 |
| 2017 | $4,240 | $56,954 | $56,954 | $0 |
| 2016 | $706 | $55,838 | $55,838 | $0 |
| 2015 | $624 | $55,000 | $55,000 | $0 |
| 2014 | $931 | $60,588 | $60,588 | $0 |
Source: Public Records
Map
Nearby Homes
- 592 Mill Valley Pkwy
- 531 Fair Hill Dr
- 651 Mission de Oro Dr
- 672 Reddington Dr
- 667 Reddington Dr
- 771 Flower Ash Ln
- 639 Alamine Dr
- 856 Mission de Oro Dr
- 825 Mission Sierra Ct
- 454 Alamine Dr
- 244 Woodhill Dr
- 647 Olympic St
- 775 Stonebriar Trail
- 11037 Erickson Way
- 5663 Terra Linda Way
- 724 Oakhurst Trail
- 1026 Palisades Ave
- 225 Ridgetop Dr Unit 214
- 481 Twin View Blvd
- 61 Tidmore Ln
- 329 Stinson Loop
- 339 Stinson Loop
- 321 Stinson Loop
- 367 Stinson Loop
- 317 Stinson Loop
- 363 Stinson Loop
- 371 Stinson Loop
- 320 Stinson Loop
- 324 Stinson Loop
- 316 Stinson Loop
- 375 Stinson Loop
- 312 Stinson Loop
- 330 Stinson Loop
- 340 Stinson Loop Unit 5, lot 10
- 340 Stinson Loop
- 346 Stinson Loop
- 346 Stinson Loop Unit 5 Lot 11
- 313 Stinson Loop
- 352 Stinson Loop
- 308 Stinson Loop
Your Personal Tour Guide
Ask me questions while you tour the home.