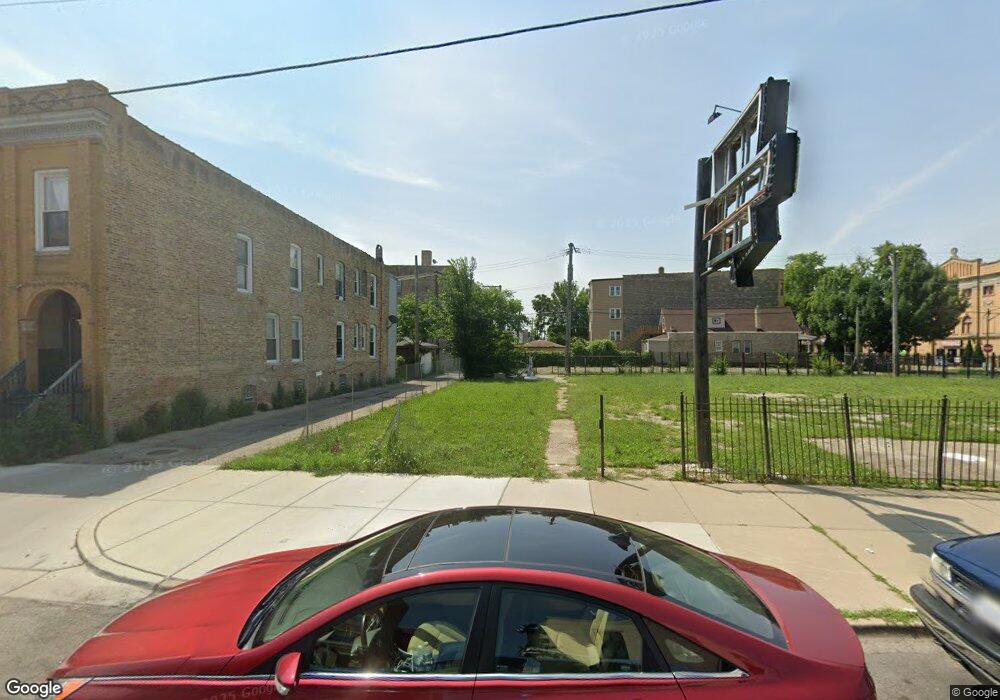
3251 W Division St Chicago, IL 60651
Humboldt Park NeighborhoodEstimated Value: $362,000
--
Bed
--
Bath
--
Sq Ft
0.27
Acres
About This Home
This home is located at 3251 W Division St, Chicago, IL 60651 and is currently estimated at $362,000. 3251 W Division St is a home located in Cook County with nearby schools including James Russell Lowell Elementary School, Orr Academy High School, and Polaris Elementary Charter Academy.
Ownership History
Date
Name
Owned For
Owner Type
Purchase Details
Closed on
Sep 11, 2019
Sold by
C I A Chaplin S In Action
Bought by
3251 W Division St Hhdc Llc
Current Estimated Value
Home Financials for this Owner
Home Financials are based on the most recent Mortgage that was taken out on this home.
Original Mortgage
$3,500,000
Interest Rate
3.6%
Mortgage Type
Commercial
Purchase Details
Closed on
Feb 8, 2013
Sold by
Pagan Minerva and Perez Minerva
Bought by
C I A Chaplains In Action
Home Financials for this Owner
Home Financials are based on the most recent Mortgage that was taken out on this home.
Original Mortgage
$80,000
Interest Rate
3.34%
Mortgage Type
Purchase Money Mortgage
Purchase Details
Closed on
Jan 1, 2007
Sold by
Perez Minerva
Bought by
Farhan Ziad
Purchase Details
Closed on
May 7, 1998
Sold by
Pagan Minerva and Pagan Georgino
Bought by
Pagan Minerva
Create a Home Valuation Report for This Property
The Home Valuation Report is an in-depth analysis detailing your home's value as well as a comparison with similar homes in the area
Home Values in the Area
Average Home Value in this Area
Purchase History
| Date | Buyer | Sale Price | Title Company |
|---|---|---|---|
| 3251 W Division St Hhdc Llc | -- | Chicago Title | |
| C I A Chaplains In Action | -- | Stewart Title Company | |
| Farhan Ziad | $600,000 | None Available | |
| Pagan Minerva | -- | -- |
Source: Public Records
Mortgage History
| Date | Status | Borrower | Loan Amount |
|---|---|---|---|
| Closed | 3251 W Division St Hhdc Llc | $3,500,000 | |
| Previous Owner | C I A Chaplains In Action | $80,000 | |
| Closed | Farhan Ziad | $0 |
Source: Public Records
Tax History Compared to Growth
Tax History
| Year | Tax Paid | Tax Assessment Tax Assessment Total Assessment is a certain percentage of the fair market value that is determined by local assessors to be the total taxable value of land and additions on the property. | Land | Improvement |
|---|---|---|---|---|
| 2024 | $2,637 | $15,430 | $15,430 | -- |
| 2023 | $2,563 | $12,463 | $12,463 | -- |
| 2022 | $2,563 | $12,463 | $12,463 | $0 |
| 2021 | $2,506 | $12,462 | $12,462 | $0 |
| 2020 | $2,776 | $12,462 | $12,462 | $0 |
| 2019 | $2,504 | $12,462 | $12,462 | $0 |
| 2018 | $2,462 | $12,462 | $12,462 | $0 |
| 2017 | $2,108 | $9,791 | $9,791 | $0 |
| 2016 | $1,961 | $9,791 | $9,791 | $0 |
| 2015 | $1,794 | $9,791 | $9,791 | $0 |
| 2014 | $1,817 | $9,791 | $9,791 | $0 |
| 2013 | $1,781 | $9,791 | $9,791 | $0 |
Source: Public Records
Map
Nearby Homes
- 3323 W Division St
- 3326 W Crystal St
- 3247 W Thomas St
- 1320 N Homan Ave
- 3143 W Augusta Blvd
- 948 N Homan Ave
- 1010 N Trumbull Ave
- 1023 N Saint Louis Ave
- 3126 W Walton St Unit 2
- 922 N Homan Ave
- 913 N Homan Ave
- 903 N Homan Ave
- 3440 W Hirsch St
- 956 N Saint Louis Ave
- 937 N Saint Louis Ave
- 3518 W Augusta Blvd
- 3523 W Hirsch St
- 3306 W Le Moyne St
- 905 N Saint Louis Ave
- 3348 W Le Moyne St
- 3251-59 W Division St
- 3251 W Division St
- 3247 W Division St
- 3247 W Division St Unit GDN
- 3247 W Division St
- 3247 W Division St Unit 1S
- 3247 W Division St Unit 2S
- 3247 W Division St Unit 2N
- 3247 W Division St Unit 1N
- 3247 W Division St Unit 1F
- 3247 W Division St Unit 2R
- 3245 W Division St Unit 1F
- 3245 W Division St
- 3245 W Division St Unit G
- 3245 W Division St Unit 2R
- 3245 W Division St Unit 1
- 3245 W Division St
- 3245 W Division St Unit 2F
- 3237 W Division St Unit 101
- 3241 W Division St