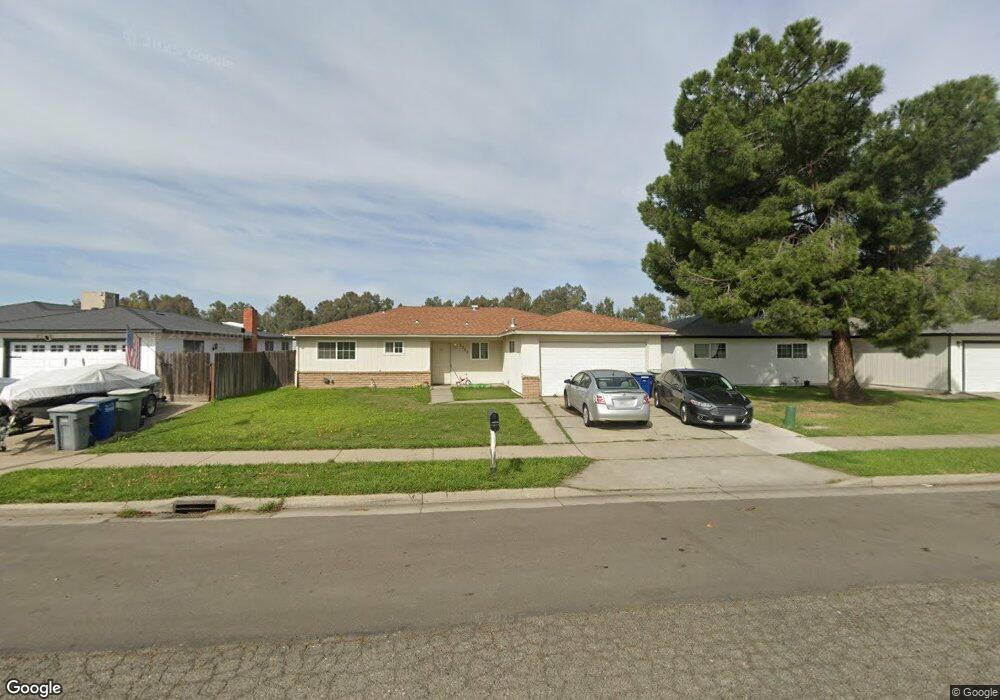
3257 Cheyenne Dr Merced, CA 95348
North Merced NeighborhoodEstimated Value: $321,000 - $350,000
3
Beds
2
Baths
1,332
Sq Ft
$252/Sq Ft
Est. Value
About This Home
This home is located at 3257 Cheyenne Dr, Merced, CA 95348 and is currently estimated at $335,053, approximately $251 per square foot. 3257 Cheyenne Dr is a home located in Merced County with nearby schools including John Muir Elementary School, Rudolph Rivera Middle School, and Merced High School.
Ownership History
Date
Name
Owned For
Owner Type
Purchase Details
Closed on
May 30, 2003
Sold by
Bennett Charles and Bennett Pamela
Bought by
Bennett Charlie and Bennett Pam
Current Estimated Value
Purchase Details
Closed on
Jan 20, 2003
Sold by
A & L Construction
Bought by
Bennett Charles and Bennett Pamela
Home Financials for this Owner
Home Financials are based on the most recent Mortgage that was taken out on this home.
Original Mortgage
$102,950
Outstanding Balance
$43,087
Interest Rate
5.76%
Estimated Equity
$291,966
Purchase Details
Closed on
Nov 11, 2002
Sold by
Hayes Raymond L and Hayes Marilyn Y
Bought by
A & L Construction
Home Financials for this Owner
Home Financials are based on the most recent Mortgage that was taken out on this home.
Original Mortgage
$106,250
Interest Rate
6.12%
Mortgage Type
Seller Take Back
Create a Home Valuation Report for This Property
The Home Valuation Report is an in-depth analysis detailing your home's value as well as a comparison with similar homes in the area
Home Values in the Area
Average Home Value in this Area
Purchase History
| Date | Buyer | Sale Price | Title Company |
|---|---|---|---|
| Bennett Charlie | -- | -- | |
| Bennett Charles | $160,000 | Fidelity Title Company | |
| A & L Construction | $125,000 | Fidelity Title Company |
Source: Public Records
Mortgage History
| Date | Status | Borrower | Loan Amount |
|---|---|---|---|
| Open | Bennett Charles | $102,950 | |
| Previous Owner | A & L Construction | $106,250 |
Source: Public Records
Tax History
| Year | Tax Paid | Tax Assessment Tax Assessment Total Assessment is a certain percentage of the fair market value that is determined by local assessors to be the total taxable value of land and additions on the property. | Land | Improvement |
|---|---|---|---|---|
| 2025 | $2,439 | $231,639 | $57,922 | $173,717 |
| 2024 | $2,439 | $227,098 | $56,787 | $170,311 |
| 2023 | $2,406 | $222,646 | $55,674 | $166,972 |
| 2022 | $2,373 | $218,282 | $54,583 | $163,699 |
| 2021 | $2,368 | $214,003 | $53,513 | $160,490 |
| 2020 | $2,386 | $211,810 | $52,965 | $158,845 |
| 2019 | $2,090 | $184,500 | $65,000 | $119,500 |
| 2018 | $1,787 | $169,500 | $55,000 | $114,500 |
| 2017 | $1,781 | $159,500 | $45,000 | $114,500 |
| 2016 | $1,704 | $152,000 | $45,000 | $107,000 |
| 2015 | $1,446 | $129,000 | $45,000 | $84,000 |
| 2014 | $1,321 | $118,000 | $30,000 | $88,000 |
Source: Public Records
Map
Nearby Homes
- 1840 Cheyenne Dr
- 3157 Juneau Ct
- 1673 Sacramento Dr
- 3406 San Martin Ct
- 3536 San Isidro Ave
- 3533 San Isidro Ave
- 1375 Loughborough Dr
- 1482 Autry Way
- 2790 N State Highway 59
- 1274 Devonwood Dr
- 2500 N State Highway 59 Unit 36
- 2500 N State Highway 59 Unit 278
- 2500 N State Highway 59 Unit 239
- 2500 N State Highway 59 Unit 18
- 2500 N State Highway 59
- 1134 Puerto Vallarta Ct
- 3360 R St
- 1201 W Donna Dr
- 1541 W North Bear Creek Dr
- 3482 Paseo Verde Ave
- 3263 Cheyenne Dr
- 3269 Cheyenne Dr
- 3245 Cheyenne Dr
- 3262 Cheyenne Dr
- 3275 Cheyenne Dr
- 3239 Cheyenne Dr
- 3268 Cheyenne Dr
- 1850 Phoenix Way
- 3274 Cheyenne Dr
- 3281 Cheyenne Dr
- 3233 Cheyenne Dr
- 1831 Phoenix Way
- 1840 Phoenix Way
- 1849 Salem Ct
- 3280 Cheyenne Dr
- 3287 Cheyenne Dr
- 3227 Cheyenne Dr
- 1829 Salem Ct
- 3239 Phoenix Way
- 1830 Phoenix Way
Your Personal Tour Guide
Ask me questions while you tour the home.