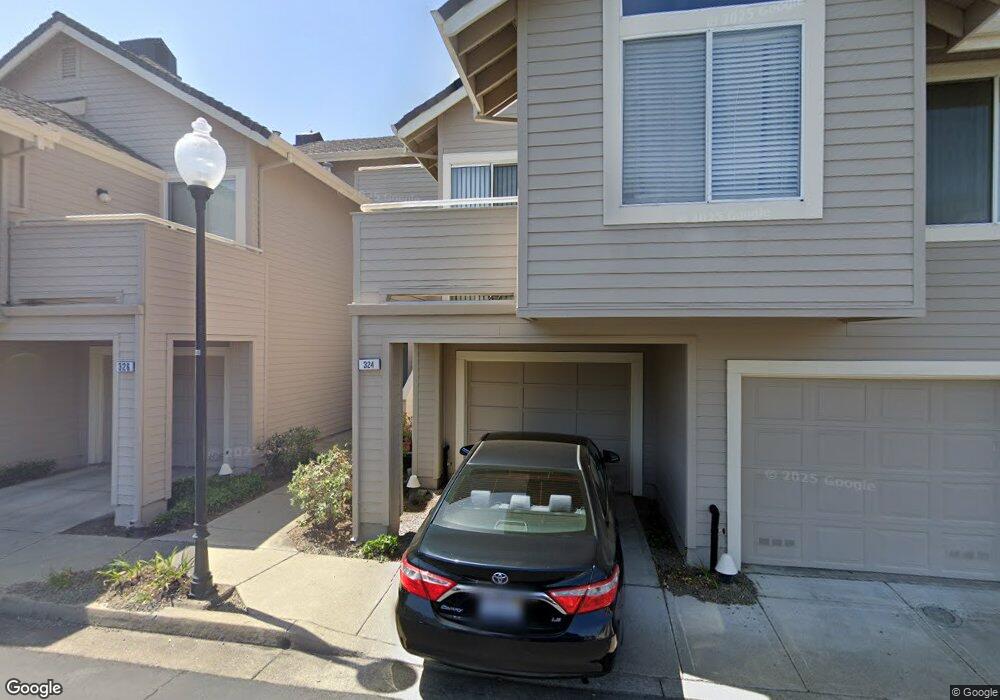
326 Crowsnest Cir Hercules, CA 94547
Estimated Value: $395,414 - $490,000
1
Bed
1
Bath
940
Sq Ft
$454/Sq Ft
Est. Value
About This Home
This home is located at 326 Crowsnest Cir, Hercules, CA 94547 and is currently estimated at $426,604, approximately $453 per square foot. 326 Crowsnest Cir is a home located in Contra Costa County with nearby schools including Hanna Ranch Elementary School, Hercules Middle School, and Hercules High School.
Ownership History
Date
Name
Owned For
Owner Type
Purchase Details
Closed on
Jun 30, 2017
Sold by
Papadopoulos Angelina
Bought by
Jones Mary Petrakis
Current Estimated Value
Home Financials for this Owner
Home Financials are based on the most recent Mortgage that was taken out on this home.
Original Mortgage
$208,587
Outstanding Balance
$172,747
Interest Rate
3.95%
Mortgage Type
FHA
Estimated Equity
$253,857
Purchase Details
Closed on
Aug 31, 2001
Sold by
Boskovic M R
Bought by
Boskovic M R
Purchase Details
Closed on
Nov 1, 2000
Sold by
Garcia Daniel E
Bought by
Boskovic M R
Purchase Details
Closed on
Sep 11, 1996
Sold by
Garcia Julene Lynnette
Bought by
Garcia Daniel E
Home Financials for this Owner
Home Financials are based on the most recent Mortgage that was taken out on this home.
Original Mortgage
$93,200
Interest Rate
8.23%
Mortgage Type
FHA
Create a Home Valuation Report for This Property
The Home Valuation Report is an in-depth analysis detailing your home's value as well as a comparison with similar homes in the area
Home Values in the Area
Average Home Value in this Area
Purchase History
| Date | Buyer | Sale Price | Title Company |
|---|---|---|---|
| Jones Mary Petrakis | $305,000 | North American Title Co Inc | |
| Boskovic M R | -- | -- | |
| Boskovic M R | $149,000 | Old Republic Title Company | |
| Garcia Daniel E | -- | First American Title Co | |
| Garcia Daniel E | $95,000 | First American Title Co | |
| Muto Diane K | -- | First American Title Co |
Source: Public Records
Mortgage History
| Date | Status | Borrower | Loan Amount |
|---|---|---|---|
| Open | Jones Mary Petrakis | $208,587 | |
| Previous Owner | Garcia Daniel E | $93,200 |
Source: Public Records
Tax History
| Year | Tax Paid | Tax Assessment Tax Assessment Total Assessment is a certain percentage of the fair market value that is determined by local assessors to be the total taxable value of land and additions on the property. | Land | Improvement |
|---|---|---|---|---|
| 2025 | $5,858 | $347,031 | $177,782 | $169,249 |
| 2024 | $5,585 | $340,228 | $174,297 | $165,931 |
| 2023 | $5,585 | $333,558 | $170,880 | $162,678 |
| 2022 | $5,521 | $327,019 | $167,530 | $159,489 |
| 2021 | $5,512 | $320,608 | $164,246 | $156,362 |
| 2019 | $5,244 | $311,100 | $159,375 | $151,725 |
| 2018 | $5,964 | $305,000 | $156,250 | $148,750 |
| 2017 | $3,783 | $193,567 | $54,359 | $139,208 |
| 2016 | $3,594 | $189,773 | $53,294 | $136,479 |
| 2015 | $3,599 | $186,923 | $52,494 | $134,429 |
| 2014 | $3,611 | $183,262 | $51,466 | $131,796 |
Source: Public Records
Map
Nearby Homes
- 301 Boatswain Ct
- 256 Napoli Ct Unit 256
- 103 Tuscany Ct
- 139 Tuscany Ct Unit 139
- 161 Seaway Ct
- 248 Carson St
- 134 Caprice Cir
- 118 Cottonwood Ct
- 211 Meadowlark Way
- 2555 Arroyo Ave
- 2620 Shady Draw
- 2654 Tamalpais Dr Unit 38
- 720 Seacliff Ct
- 1723 Pheasant Dr
- 405 Weymouth
- 938 Sandy Cove Dr
- 120 Bonita Ct
- 704 Windsor Unit 704
- 103 Obsidian Way
- 176 Bedford
- 324 Crowsnest Cir
- 332 Crowsnest Cir Unit 332
- 384 Porthole Ct
- 322 Crowsnest Cir
- 328 Crowsnest Cir
- 330 Crowsnest Cir
- 320 Crowsnest Cir
- 303 Boatswain Ct Unit 303
- 305 Boatswain Ct Unit 305
- 307 Boatswain Ct
- 336 Crowsnest Cir
- 334 Crowsnest Cir Unit 334
- 309 Boatswain Ct
- 311 Boatswain Ct Unit 311
- 314 Boatswain Ct
- 344 Crowsnest Cir Unit 344
- 306 Boatswain Ct
- 345 Lagoon Cir Unit 345
- 302 Boatswain Ct Unit 302
- 304 Boatswain Ct
Your Personal Tour Guide
Ask me questions while you tour the home.