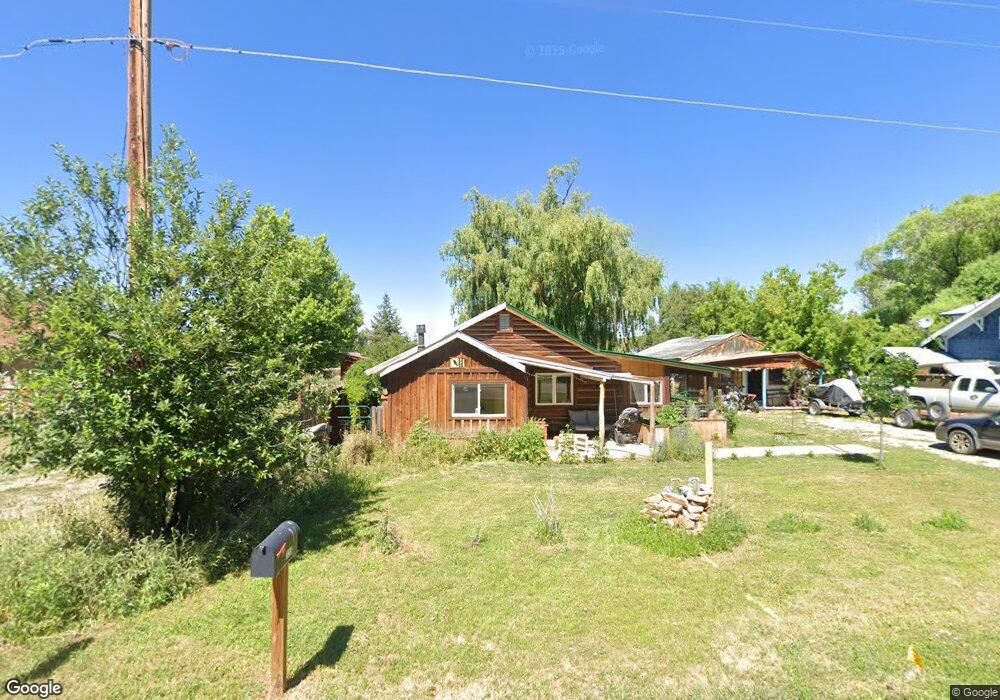
326 S Walnut St Mancos, CO 81328
Estimated Value: $289,319 - $408,000
2
Beds
1
Bath
977
Sq Ft
$340/Sq Ft
Est. Value
About This Home
This home is located at 326 S Walnut St, Mancos, CO 81328 and is currently estimated at $332,080, approximately $339 per square foot. 326 S Walnut St is a home located in Montezuma County with nearby schools including Mancos Elementary School, Mancos Middle School, and Mancos High School.
Ownership History
Date
Name
Owned For
Owner Type
Purchase Details
Closed on
May 27, 2020
Sold by
Manning Nick W and Manning Nicholas
Bought by
Manning Nicholas W
Current Estimated Value
Home Financials for this Owner
Home Financials are based on the most recent Mortgage that was taken out on this home.
Original Mortgage
$138,750
Outstanding Balance
$97,762
Interest Rate
3.3%
Mortgage Type
New Conventional
Estimated Equity
$234,318
Purchase Details
Closed on
Jan 27, 2015
Sold by
Bretl Emily
Bought by
Manning Nicholas
Purchase Details
Closed on
Mar 26, 2013
Sold by
Bolotin Michael W
Bought by
Manning Nick W and Bretl Emily C
Home Financials for this Owner
Home Financials are based on the most recent Mortgage that was taken out on this home.
Original Mortgage
$60,000
Interest Rate
3.59%
Mortgage Type
Unknown
Purchase Details
Closed on
Jan 6, 2010
Sold by
Velasquez Elisa and Sena Elisa
Bought by
Bolotin Michael W
Create a Home Valuation Report for This Property
The Home Valuation Report is an in-depth analysis detailing your home's value as well as a comparison with similar homes in the area
Home Values in the Area
Average Home Value in this Area
Purchase History
| Date | Buyer | Sale Price | Title Company |
|---|---|---|---|
| Manning Nicholas W | -- | None Available | |
| Manning Nicholas | -- | None Available | |
| Manning Nick W | $67,500 | Colorado Land Title Co | |
| Bolotin Michael W | $92,500 | Colorado Land Title Co |
Source: Public Records
Mortgage History
| Date | Status | Borrower | Loan Amount |
|---|---|---|---|
| Open | Manning Nicholas W | $138,750 | |
| Previous Owner | Manning Nick W | $60,000 |
Source: Public Records
Tax History Compared to Growth
Tax History
| Year | Tax Paid | Tax Assessment Tax Assessment Total Assessment is a certain percentage of the fair market value that is determined by local assessors to be the total taxable value of land and additions on the property. | Land | Improvement |
|---|---|---|---|---|
| 2024 | $612 | $9,082 | $3,229 | $5,853 |
| 2023 | $612 | $13,460 | $4,786 | $8,674 |
| 2022 | $690 | $9,996 | $3,446 | $6,550 |
| 2021 | $701 | $9,996 | $3,446 | $6,550 |
| 2020 | $627 | $10,014 | $3,446 | $6,568 |
| 2019 | $672 | $10,014 | $3,446 | $6,568 |
| 2018 | $538 | $6,490 | $3,120 | $3,370 |
| 2017 | $455 | $6,490 | $3,120 | $3,370 |
| 2016 | $456 | $6,600 | $3,450 | $3,150 |
| 2015 | $443 | $96,110 | $0 | $0 |
| 2014 | $443 | $6,600 | $0 | $0 |
Source: Public Records
Map
Nearby Homes
- TBD Road J
- 115 & 119 W Grand
- 646 Riverside Ave
- 133 E Menefee St
- 417 Angel Way
- 387 Angel Way
- 40781 Hwy 160 Unit 10
- TBD Road 36 5
- TBD Lot1 Road H
- TBD Lot 2 Road H
- TBD Road 43
- TBD Road 41
- 0 Tbd Hwy 160 Unit 25185992
- 44501 N Hwy 160
- 3217 County Rd 41
- 11555 Road 39
- 38330 Road G Rd
- TBD Road 46
- 38203 County Road L 8
- 37988 & 38014 Highway 184
- 0 Walnut St Unit 666340
- 312 S Walnut St
- S Walnut
- 334 S Walnut St
- 335 S Walnut St
- W 2nd Ave
- 238 S Walnut St
- 232 S Walnut St
- 123 2nd St
- 235 S Walnut St
- 225 S Walnut St
- 346 S Walnut St
- 334 S Mesa St
- 338 S Mesa St
- 310 S Mesa St
- 217 S Walnut St
- S Mesa St
- 348 S Mesa St
- 0 S Mesa St Unit 695671
- 0 S Mesa St Unit 698245