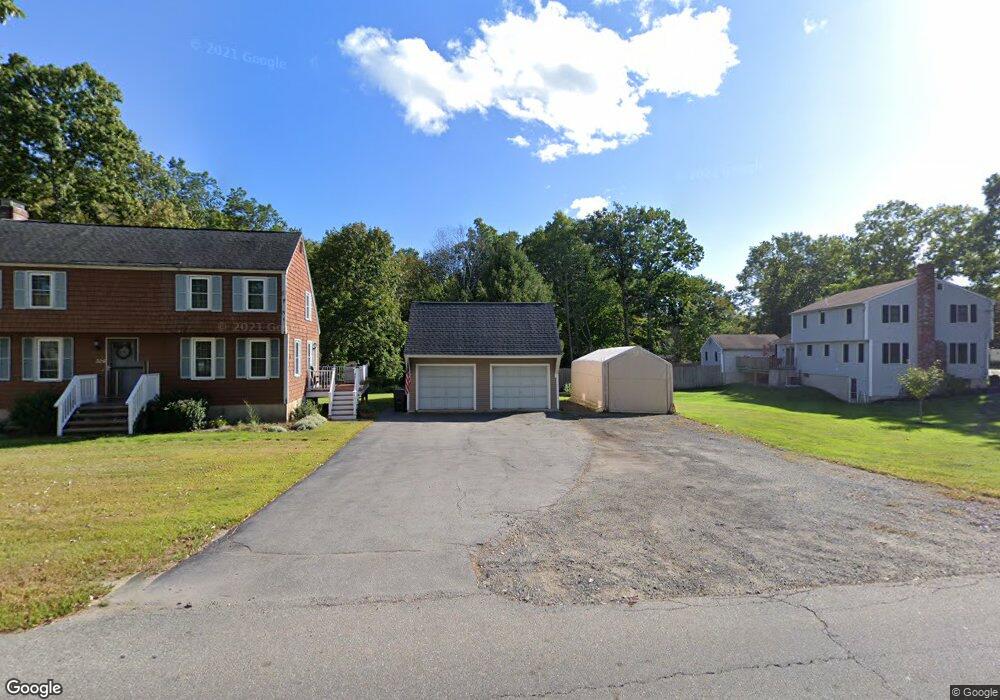
326 Tyler St Dracut, MA 01826
Estimated Value: $582,145 - $726,000
3
Beds
2
Baths
1,666
Sq Ft
$397/Sq Ft
Est. Value
About This Home
This home is located at 326 Tyler St, Dracut, MA 01826 and is currently estimated at $661,786, approximately $397 per square foot. 326 Tyler St is a home located in Middlesex County with nearby schools including Joseph A. Campbell Elementary School, Richardson Middle School, and Dracut Senior High School.
Ownership History
Date
Name
Owned For
Owner Type
Purchase Details
Closed on
Mar 17, 2011
Sold by
Fnma
Bought by
Williams Kelly and Scofield Alan
Current Estimated Value
Home Financials for this Owner
Home Financials are based on the most recent Mortgage that was taken out on this home.
Original Mortgage
$263,840
Outstanding Balance
$178,395
Interest Rate
4.84%
Mortgage Type
Purchase Money Mortgage
Estimated Equity
$483,391
Purchase Details
Closed on
Oct 5, 2010
Sold by
Simmons Gerald R
Bought by
Federal National Mortgage Association
Purchase Details
Closed on
Mar 31, 2006
Sold by
Janeczek Susan J
Bought by
Simmons Donna L and Simmons Gerald R
Home Financials for this Owner
Home Financials are based on the most recent Mortgage that was taken out on this home.
Original Mortgage
$346,750
Interest Rate
6.32%
Mortgage Type
Purchase Money Mortgage
Create a Home Valuation Report for This Property
The Home Valuation Report is an in-depth analysis detailing your home's value as well as a comparison with similar homes in the area
Home Values in the Area
Average Home Value in this Area
Purchase History
| Date | Buyer | Sale Price | Title Company |
|---|---|---|---|
| Williams Kelly | $272,000 | -- | |
| Federal National Mortgage Association | $331,129 | -- | |
| Simmons Donna L | $365,000 | -- |
Source: Public Records
Mortgage History
| Date | Status | Borrower | Loan Amount |
|---|---|---|---|
| Open | Williams Kelly | $263,840 | |
| Previous Owner | Simmons Donna L | $346,750 |
Source: Public Records
Tax History
| Year | Tax Paid | Tax Assessment Tax Assessment Total Assessment is a certain percentage of the fair market value that is determined by local assessors to be the total taxable value of land and additions on the property. | Land | Improvement |
|---|---|---|---|---|
| 2025 | $5,597 | $553,100 | $251,600 | $301,500 |
| 2024 | $5,358 | $512,700 | $239,800 | $272,900 |
| 2023 | $5,346 | $461,700 | $208,600 | $253,100 |
| 2022 | $5,195 | $422,700 | $189,700 | $233,000 |
| 2021 | $4,405 | $385,900 | $172,200 | $213,700 |
| 2020 | $4,886 | $366,000 | $167,100 | $198,900 |
| 2019 | $4,698 | $341,700 | $159,100 | $182,600 |
| 2018 | $3,915 | $340,500 | $159,100 | $181,400 |
| 2017 | $4,804 | $340,500 | $159,100 | $181,400 |
| 2016 | $4,790 | $322,800 | $159,900 | $162,900 |
| 2015 | $4,658 | $312,000 | $159,900 | $152,100 |
| 2014 | $4,392 | $303,100 | $159,900 | $143,200 |
Source: Public Records
Map
Nearby Homes
Your Personal Tour Guide
Ask me questions while you tour the home.