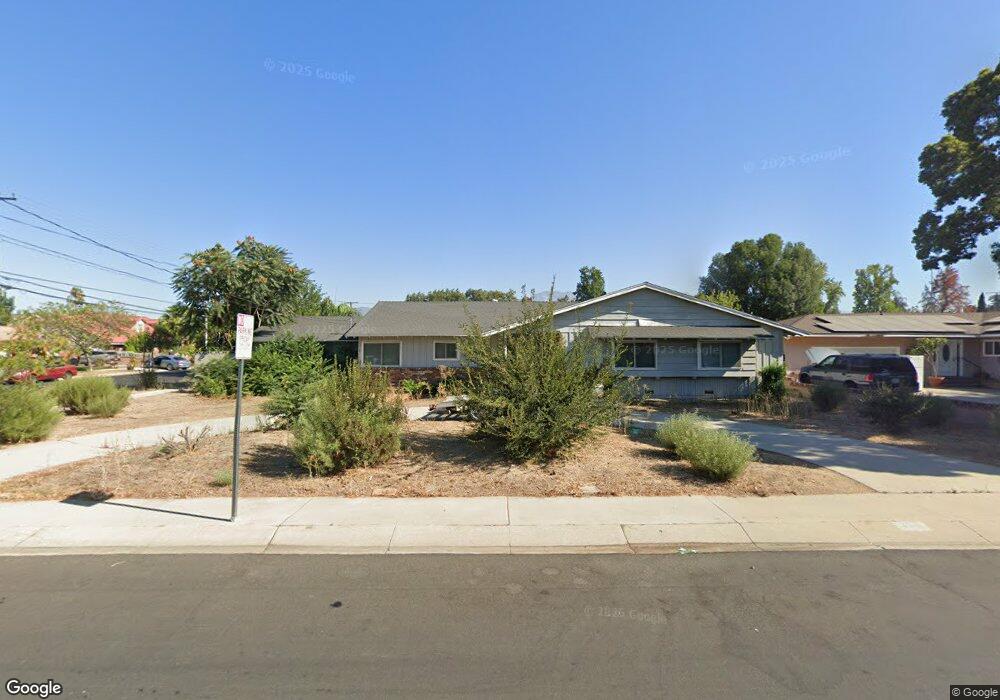
326 W Elm St Ontario, CA 91762
Downtown Ontario NeighborhoodEstimated Value: $658,000 - $800,000
3
Beds
2
Baths
1,806
Sq Ft
$416/Sq Ft
Est. Value
About This Home
This home is located at 326 W Elm St, Ontario, CA 91762 and is currently estimated at $750,681, approximately $415 per square foot. 326 W Elm St is a home located in San Bernardino County with nearby schools including Richard Haynes Elementary, Oaks Middle, and Ontario High School.
Ownership History
Date
Name
Owned For
Owner Type
Purchase Details
Closed on
Mar 6, 2024
Sold by
Martino Al and Martino Albert J
Bought by
Katrina Lp
Current Estimated Value
Purchase Details
Closed on
Apr 28, 2010
Sold by
Howie Jeff and Howie Jill
Bought by
Martino Al
Purchase Details
Closed on
Jan 9, 2007
Sold by
Howie Jill
Bought by
Howie Jeff and Howie Jill
Home Financials for this Owner
Home Financials are based on the most recent Mortgage that was taken out on this home.
Original Mortgage
$100,000
Interest Rate
6.1%
Mortgage Type
New Conventional
Purchase Details
Closed on
Oct 14, 2004
Sold by
Howie Jeff
Bought by
Howie Jill
Purchase Details
Closed on
Feb 3, 2004
Sold by
Howie Jill
Bought by
Howie Jeff
Purchase Details
Closed on
Jul 17, 2003
Sold by
Rocha Grace L
Bought by
Rocha Grace L and Arredondo Delores
Create a Home Valuation Report for This Property
The Home Valuation Report is an in-depth analysis detailing your home's value as well as a comparison with similar homes in the area
Home Values in the Area
Average Home Value in this Area
Purchase History
| Date | Buyer | Sale Price | Title Company |
|---|---|---|---|
| Katrina Lp | -- | None Listed On Document | |
| Martino Ai | -- | None Listed On Document | |
| Martino Al | -- | None Available | |
| Howie Jeff | -- | Lawyers Title Co | |
| Howie Jill | -- | Southland Title | |
| Howie Jeff | -- | Fidelity National Title Co | |
| Howie Jeff | $250,000 | Fidelity National Title Co | |
| Ethridge Grace Ann | -- | Fidelity National Title Co | |
| Arredondo Delores | -- | Fidelity National Title Co | |
| Rocha Grace L | -- | -- |
Source: Public Records
Mortgage History
| Date | Status | Borrower | Loan Amount |
|---|---|---|---|
| Previous Owner | Howie Jeff | $100,000 |
Source: Public Records
Tax History Compared to Growth
Tax History
| Year | Tax Paid | Tax Assessment Tax Assessment Total Assessment is a certain percentage of the fair market value that is determined by local assessors to be the total taxable value of land and additions on the property. | Land | Improvement |
|---|---|---|---|---|
| 2025 | $3,215 | $298,385 | $104,435 | $193,950 |
| 2024 | $3,215 | $292,534 | $102,387 | $190,147 |
| 2023 | $3,125 | $286,798 | $100,379 | $186,419 |
| 2022 | $3,084 | $281,175 | $98,411 | $182,764 |
| 2021 | $3,065 | $275,661 | $96,481 | $179,180 |
| 2020 | $3,011 | $272,835 | $95,492 | $177,343 |
| 2019 | $2,985 | $267,486 | $93,620 | $173,866 |
| 2018 | $2,944 | $262,241 | $91,784 | $170,457 |
| 2017 | $2,839 | $257,099 | $89,984 | $167,115 |
| 2016 | $2,727 | $252,058 | $88,220 | $163,838 |
| 2015 | $2,708 | $248,272 | $86,895 | $161,377 |
| 2014 | $2,624 | $243,409 | $85,193 | $158,216 |
Source: Public Records
Map
Nearby Homes
- 1420 S Euclid Ave Unit A & B
- 4251 S Grasly Paseo
- 559 W Belmont St
- 1546 Redwood Ave
- 550 W Belmont St
- 653 W Belmont St
- 646 W Belmont St
- 410 W Maitland St
- 1540 S Pleasant Ave
- 1343 S Sultana Ave
- 1849 S San Antonio Ave
- 1214 S Sultana Ave
- 1620 S Cypress Ave
- 754 W Belmont St
- 1949 S Palm Place
- 1214 S Cypress Ave Unit G
- 1216 S Cypress Ave Unit E
- 718 S Vine Ave Unit A
- 1650 S Campus Ave Unit 21
- 1650 S Campus Ave Unit 20