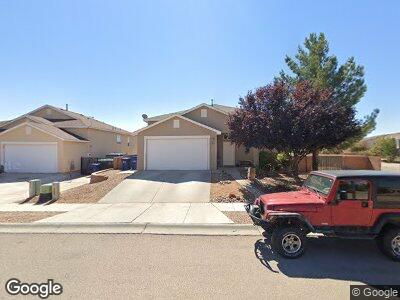
3261 Clear Sky St SW Unit 1 Los Lunas, NM 87031
West Los Lunas NeighborhoodEstimated Value: $364,000 - $419,000
5
Beds
3
Baths
2,835
Sq Ft
$136/Sq Ft
Est. Value
About This Home
This home is located at 3261 Clear Sky St SW Unit 1, Los Lunas, NM 87031 and is currently estimated at $386,522, approximately $136 per square foot. 3261 Clear Sky St SW Unit 1 is a home located in Valencia County with nearby schools including Sundance Elementary School, Los Lunas Middle School, and Los Lunas High School.
Ownership History
Date
Name
Owned For
Owner Type
Purchase Details
Closed on
Sep 1, 2020
Sold by
Villanueva Reyes Nonato and Villanueva Roxanne
Bought by
Villanueva Reyes Nonato and Villanueva Roxanne
Current Estimated Value
Home Financials for this Owner
Home Financials are based on the most recent Mortgage that was taken out on this home.
Original Mortgage
$30,000
Interest Rate
2.9%
Mortgage Type
Stand Alone Second
Purchase Details
Closed on
Nov 7, 2006
Sold by
Artistic Homes Inc
Bought by
Villanueva Rozanne and Villanueva Reyes
Home Financials for this Owner
Home Financials are based on the most recent Mortgage that was taken out on this home.
Original Mortgage
$232,750
Interest Rate
6.37%
Mortgage Type
New Conventional
Purchase Details
Closed on
Feb 8, 2006
Sold by
Curb South Llc
Bought by
Artistic Homes Inc
Create a Home Valuation Report for This Property
The Home Valuation Report is an in-depth analysis detailing your home's value as well as a comparison with similar homes in the area
Home Values in the Area
Average Home Value in this Area
Purchase History
| Date | Buyer | Sale Price | Title Company |
|---|---|---|---|
| Villanueva Reyes Nonato | -- | Fidelity National Ttl Of Nm | |
| Villanueva Rozanne | -- | First American Title Ins Co | |
| Artistic Homes Inc | -- | First American Title Ins Co |
Source: Public Records
Mortgage History
| Date | Status | Borrower | Loan Amount |
|---|---|---|---|
| Open | Villanueva Reyes Nonato | $93,700 | |
| Closed | Villanueva Reyes Nonato | $30,000 | |
| Open | Villanueva Roxanne | $180,000 | |
| Closed | Villanueva Reyes W | $233,211 | |
| Closed | Villanueva Rozanne | $232,750 |
Source: Public Records
Tax History Compared to Growth
Tax History
| Year | Tax Paid | Tax Assessment Tax Assessment Total Assessment is a certain percentage of the fair market value that is determined by local assessors to be the total taxable value of land and additions on the property. | Land | Improvement |
|---|---|---|---|---|
| 2024 | $3,391 | $102,423 | $11,683 | $90,740 |
| 2023 | $3,271 | $99,440 | $11,073 | $88,367 |
| 2022 | $3,217 | $96,544 | $10,482 | $86,062 |
| 2021 | $3,153 | $93,732 | $10,796 | $82,936 |
| 2020 | $3,120 | $91,003 | $10,482 | $80,521 |
| 2019 | $3,137 | $91,003 | $10,482 | $80,521 |
| 2018 | $3,069 | $90,613 | $10,482 | $80,131 |
| 2017 | $2,934 | $87,974 | $10,482 | $77,492 |
| 2016 | $2,853 | $85,411 | $10,482 | $74,929 |
| 2015 | -- | $82,924 | $10,482 | $72,442 |
| 2013 | -- | $78,164 | $10,482 | $67,682 |
| 2011 | -- | $227,664 | $30,531 | $197,133 |
Source: Public Records
Map
Nearby Homes
- 3461 Lonetree St SW
- 3000 Clear Sky St SW
- 3581 Sun Mesa St SW
- 760 Rain Lily Rd SW
- 3271 Prairie Ridge St SW
- 3560 Santa fe St
- 3560 Santa fe St
- 3560 Santa fe St
- 3560 Santa fe St
- 2640 Firewheel Ave SW
- 471 Chafey Dr SW
- 860 Oregeon Trail SW
- 880 Oregeon Trail SW
- 520 Rio Chama Cir SW
- 700 Primrose Ave SW
- 920 Oregeon Trail SW
- 460 Rio Chama Cir SW
- 440 Rio Chama Cir SW
- 590 Rio Chama Cir SW
- 5109 Findley Ave SW
- 3261 Clear Sky St SW
- 3261 Clear Sky St SW Unit 1
- 3241 Clear Sky St SW
- 3221 Clear Sky St SW
- 3221 Clear Sky St SW Unit 1
- 410 Open Range Ave SW
- 3201 Clear Sky St SW
- 400 Open Range Ave SW
- 411 Open Range Ave SW
- 401 Open Range Ave SW
- 551 Blue Sage Ave SW
- 345 Cloud View Ave SW
- 541 Blue Sage Ave SW
- 390 Open Range Ave SW
- 3181 Clear Sky St SW
- 561 Blue Sage Ave SW
- 521 Blue Sage Ave SW
- 335 Cloud View Ave SW
- 511 Blue Sage Ave SW
- 370 Open Range Ave SW