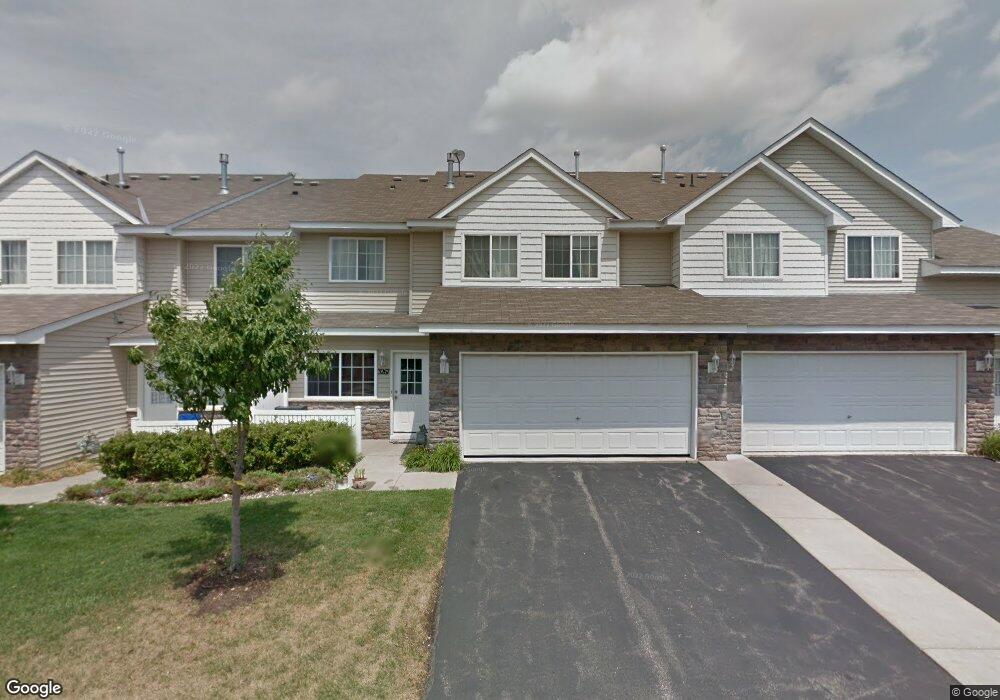
3267 Coleshire Path Rosemount, MN 55068
Estimated Value: $261,437 - $277,000
3
Beds
2
Baths
1,428
Sq Ft
$188/Sq Ft
Est. Value
About This Home
This home is located at 3267 Coleshire Path, Rosemount, MN 55068 and is currently estimated at $267,859, approximately $187 per square foot. 3267 Coleshire Path is a home located in Dakota County with nearby schools including Shannon Park Elementary School, Rosemount Middle School, and Rosemount Senior High School.
Ownership History
Date
Name
Owned For
Owner Type
Purchase Details
Closed on
Mar 8, 2019
Sold by
Rahhali Ayoub and Belaid Yamna Nid
Bought by
Antony Brandon and Antony Nicole
Current Estimated Value
Home Financials for this Owner
Home Financials are based on the most recent Mortgage that was taken out on this home.
Original Mortgage
$136,500
Outstanding Balance
$120,007
Interest Rate
4.4%
Mortgage Type
New Conventional
Estimated Equity
$147,852
Purchase Details
Closed on
Jan 29, 2016
Sold by
Ngo Simon Phuc and Nguyen Kimchi Thi
Bought by
Rahhali Ayoub and Belaid Yamna Nid
Home Financials for this Owner
Home Financials are based on the most recent Mortgage that was taken out on this home.
Original Mortgage
$132,905
Interest Rate
3.95%
Mortgage Type
New Conventional
Purchase Details
Closed on
Sep 30, 2004
Sold by
D R Horton Inc Mn
Bought by
Ngo Simon Phuc and Nguyen Kimchi Thi
Create a Home Valuation Report for This Property
The Home Valuation Report is an in-depth analysis detailing your home's value as well as a comparison with similar homes in the area
Home Values in the Area
Average Home Value in this Area
Purchase History
| Date | Buyer | Sale Price | Title Company |
|---|---|---|---|
| Antony Brandon | $182,000 | Gibraltar Title | |
| Rahhali Ayoub | $139,900 | Titlesmart Inc | |
| Ngo Simon Phuc | $169,400 | -- |
Source: Public Records
Mortgage History
| Date | Status | Borrower | Loan Amount |
|---|---|---|---|
| Open | Antony Brandon | $136,500 | |
| Previous Owner | Rahhali Ayoub | $132,905 |
Source: Public Records
Tax History
| Year | Tax Paid | Tax Assessment Tax Assessment Total Assessment is a certain percentage of the fair market value that is determined by local assessors to be the total taxable value of land and additions on the property. | Land | Improvement |
|---|---|---|---|---|
| 2024 | $2,480 | $240,200 | $56,100 | $184,100 |
| 2023 | $2,480 | $228,200 | $55,800 | $172,400 |
| 2022 | $2,164 | $228,600 | $55,600 | $173,000 |
| 2021 | $2,092 | $190,400 | $48,400 | $142,000 |
| 2020 | $1,898 | $180,000 | $46,100 | $133,900 |
| 2019 | $1,588 | $172,500 | $43,900 | $128,600 |
| 2018 | $1,484 | $155,200 | $41,000 | $114,200 |
| 2017 | $1,494 | $142,700 | $39,100 | $103,600 |
| 2016 | $1,864 | $138,500 | $37,900 | $100,600 |
| 2015 | $1,725 | $145,500 | $36,500 | $109,000 |
| 2014 | -- | $134,200 | $34,300 | $99,900 |
| 2013 | -- | $117,400 | $30,200 | $87,200 |
Source: Public Records
Map
Nearby Homes
- 3275 Coleshire Path Unit 24
- 13668 Corcoran Ave Unit 35
- 3324 137th St W
- 3348 137th St W
- 13381 Cadogan Way
- 13371 Cadogan Way
- 13351 Cadogan Way
- 13380 Cadogan Way
- 2894 138th St W Unit 48
- 13341 Cadogan Way
- 13370 Cadogan Way
- 13360 Cadogan Way
- 13701 Brookside Path
- 13290 Cadogan Way
- 2610 133rd St W Unit 402
- 13433 Brick Path Unit 601
- 2588 136th St W Unit 91
- 3405 144th St W
- 13398 Danube Cir
- 13526 Daisy Ct
- 3268 136th St W
- 3259 Coleshire Path
- 3260 136th St W
- 3275 Coleshire Path
- 3283 Coleshire Path
- 3283 Coleshire Path Unit 25
- 3284 136th St W Unit 18
- 3284 136th St W
- 3267 136th St W
- 3279 136th St W
- 3285 136th St W
- 3291 136th St W
- 3276 136th St W
- 3292 136th St W
- 3323 Coleshire Path Unit 16
- 13687 Corchman Ave Unit 66
- 13693 Corchman Ave
- 13699 Corchman Ave
- 13698 Corcoran Ave
- 13692 Corcoran Ave