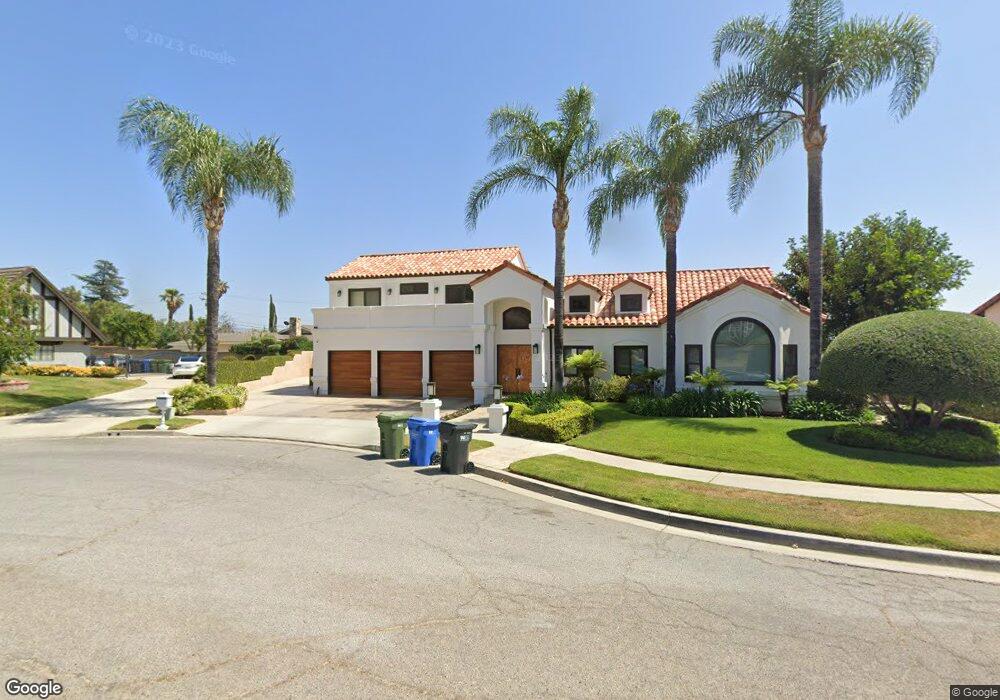
3268 Yardley Place Simi Valley, CA 93063
Central Simi Valley NeighborhoodEstimated Value: $1,385,000 - $1,645,000
5
Beds
4
Baths
4,037
Sq Ft
$382/Sq Ft
Est. Value
About This Home
This home is located at 3268 Yardley Place, Simi Valley, CA 93063 and is currently estimated at $1,543,936, approximately $382 per square foot. 3268 Yardley Place is a home located in Ventura County with nearby schools including Township Elementary School, Valley View Middle School, and Simi Valley High School.
Ownership History
Date
Name
Owned For
Owner Type
Purchase Details
Closed on
Feb 22, 2007
Sold by
Mardirosian Garabet and Mardirosian Garabed
Bought by
Mardirosian Garabed
Current Estimated Value
Purchase Details
Closed on
Jun 25, 2003
Sold by
Mardirosian Deborah
Bought by
Mardirosian Garabet
Home Financials for this Owner
Home Financials are based on the most recent Mortgage that was taken out on this home.
Original Mortgage
$322,700
Outstanding Balance
$135,086
Interest Rate
5.17%
Mortgage Type
Purchase Money Mortgage
Estimated Equity
$1,408,850
Purchase Details
Closed on
Oct 4, 1995
Sold by
Household Finance Corp
Bought by
Mardirosian Garabet and Mardirosian Deborah
Home Financials for this Owner
Home Financials are based on the most recent Mortgage that was taken out on this home.
Original Mortgage
$250,000
Interest Rate
7.09%
Create a Home Valuation Report for This Property
The Home Valuation Report is an in-depth analysis detailing your home's value as well as a comparison with similar homes in the area
Home Values in the Area
Average Home Value in this Area
Purchase History
| Date | Buyer | Sale Price | Title Company |
|---|---|---|---|
| Mardirosian Garabed | -- | None Available | |
| Mardirosian Garabet | -- | -- | |
| Mardirosian Garabet | $450,000 | Fidelity National Title |
Source: Public Records
Mortgage History
| Date | Status | Borrower | Loan Amount |
|---|---|---|---|
| Open | Mardirosian Garabet | $322,700 | |
| Closed | Mardirosian Garabet | $250,000 |
Source: Public Records
Tax History
| Year | Tax Paid | Tax Assessment Tax Assessment Total Assessment is a certain percentage of the fair market value that is determined by local assessors to be the total taxable value of land and additions on the property. | Land | Improvement |
|---|---|---|---|---|
| 2025 | $9,848 | $823,910 | $249,175 | $574,735 |
| 2024 | $9,848 | $807,755 | $244,289 | $563,466 |
| 2023 | $9,277 | $791,917 | $239,499 | $552,418 |
| 2022 | $9,269 | $776,390 | $234,803 | $541,587 |
| 2021 | $9,228 | $761,167 | $230,199 | $530,968 |
| 2020 | $9,059 | $753,365 | $227,840 | $525,525 |
| 2019 | $8,662 | $738,594 | $223,373 | $515,221 |
| 2018 | $8,608 | $724,113 | $218,994 | $505,119 |
| 2017 | $8,435 | $709,915 | $214,700 | $495,215 |
| 2016 | $8,073 | $695,996 | $210,491 | $485,505 |
| 2015 | $7,922 | $685,543 | $207,330 | $478,213 |
| 2014 | $7,829 | $672,117 | $203,270 | $468,847 |
Source: Public Records
Map
Nearby Homes
- 3319 Township Ave
- 3477 Vicki Ct
- 3039 Country Ln
- 3279 Avenida Simi
- 6505 Canyon Oaks Dr
- 3259 Valarie Ave
- 2972 Ivory Ave
- 3307 Cole Ave
- 3049 Tallahassee Ln
- 2727 Reservoir Dr
- 3445 Highwood Ct Unit 128
- 2671 Coral Gum Ln
- 3434 Highwood Ct Unit 183
- 3474 Highwood Ct Unit 80
- 3458 Highwood Ct Unit 198
- 2579 Little Rock Ln
- 2781 N Woodrow Ave
- 2696 Santa Ynez Ave
- 3028 Harrison Ln
- 3264 Darby St Unit 142
- 3252 Yardley Place
- 3305 Township Ave
- 3284 Yardley Place
- 3216 Yardley Place
- 3300 Township Ave
- 3275 Yardley Place
- 3260 Township Ave
- 3259 Yardley Place
- 3341 Township Ave Unit 1/2
- 3341 Township Ave
- 3191 Sapphire Ave
- 3291 Yardley Place
- 3248 Township Ave
- 3243 Yardley Place
- 3179 Sapphire Ave
- 3307 Township Ave
- 3209 Yardley Place
- 3330 Township Ave
- 3225 Yardley Place
- 0 Ditch Rd Unit 12010087
Your Personal Tour Guide
Ask me questions while you tour the home.