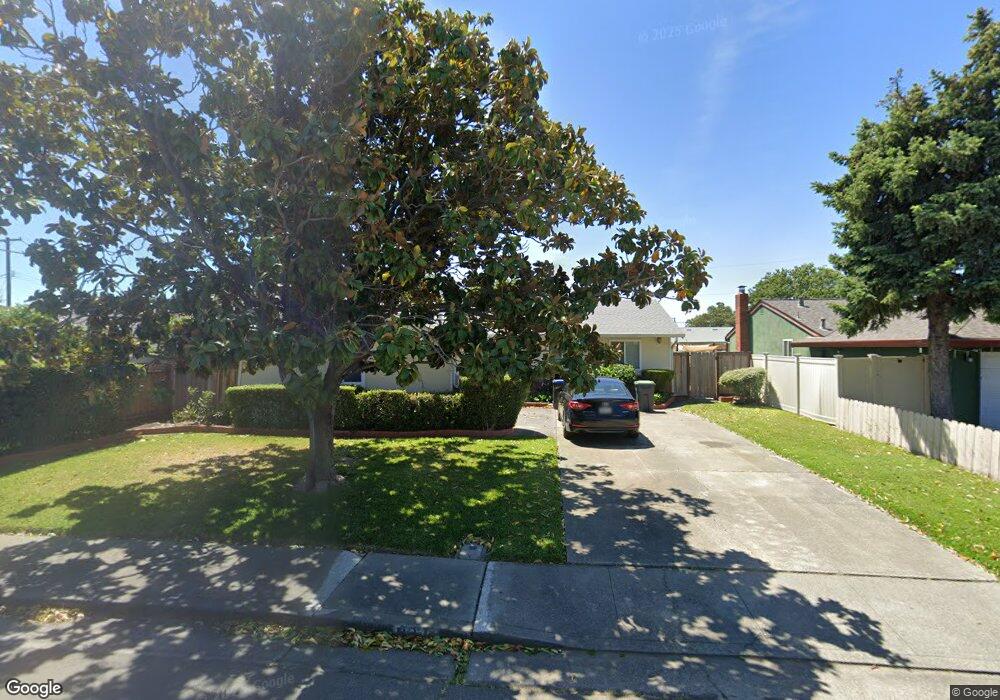
327 Begonia Blvd Fairfield, CA 94533
Estimated Value: $478,000 - $532,000
3
Beds
2
Baths
1,391
Sq Ft
$360/Sq Ft
Est. Value
About This Home
This home is located at 327 Begonia Blvd, Fairfield, CA 94533 and is currently estimated at $500,653, approximately $359 per square foot. 327 Begonia Blvd is a home located in Solano County with nearby schools including Dover Elementary School, Grange Middle School, and Fairfield High School.
Ownership History
Date
Name
Owned For
Owner Type
Purchase Details
Closed on
Oct 30, 2018
Sold by
Jett Sigurd and Jett Gladys M
Bought by
Collins Sarah
Current Estimated Value
Home Financials for this Owner
Home Financials are based on the most recent Mortgage that was taken out on this home.
Original Mortgage
$244,200
Outstanding Balance
$213,394
Interest Rate
4.5%
Mortgage Type
FHA
Estimated Equity
$287,259
Create a Home Valuation Report for This Property
The Home Valuation Report is an in-depth analysis detailing your home's value as well as a comparison with similar homes in the area
Home Values in the Area
Average Home Value in this Area
Purchase History
| Date | Buyer | Sale Price | Title Company |
|---|---|---|---|
| Collins Sarah | $255,000 | Old Republic Title Co |
Source: Public Records
Mortgage History
| Date | Status | Borrower | Loan Amount |
|---|---|---|---|
| Open | Collins Sarah | $244,200 |
Source: Public Records
Tax History
| Year | Tax Paid | Tax Assessment Tax Assessment Total Assessment is a certain percentage of the fair market value that is determined by local assessors to be the total taxable value of land and additions on the property. | Land | Improvement |
|---|---|---|---|---|
| 2025 | $4,318 | $385,963 | $72,505 | $313,458 |
| 2024 | $4,318 | $378,396 | $71,084 | $307,312 |
| 2023 | $4,185 | $370,978 | $69,691 | $301,287 |
| 2022 | $4,134 | $363,705 | $68,325 | $295,380 |
| 2021 | $4,093 | $356,575 | $66,986 | $289,589 |
| 2020 | $3,998 | $352,920 | $66,300 | $286,620 |
| 2019 | $3,899 | $346,000 | $65,000 | $281,000 |
| 2018 | $870 | $71,146 | $12,924 | $58,222 |
| 2017 | $750 | $69,752 | $12,671 | $57,081 |
| 2016 | $734 | $68,385 | $12,423 | $55,962 |
| 2015 | $685 | $67,359 | $12,237 | $55,122 |
| 2014 | $677 | $66,041 | $11,998 | $54,043 |
Source: Public Records
Map
Nearby Homes
Your Personal Tour Guide
Ask me questions while you tour the home.