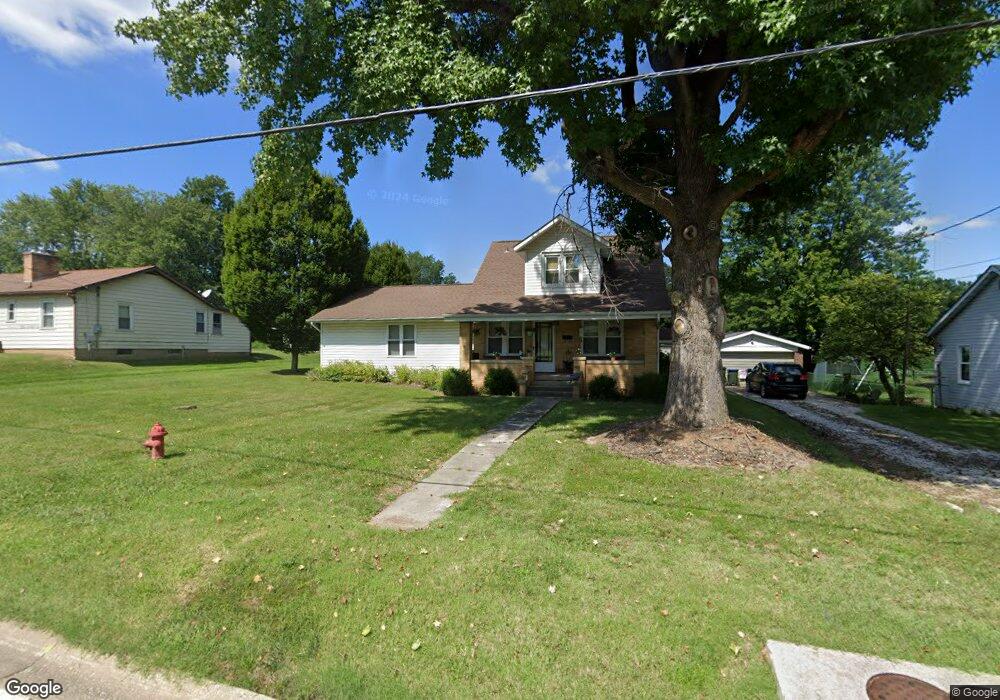
327 Front St Waterloo, IL 62298
Estimated Value: $223,647 - $282,000
2
Beds
--
Bath
1,472
Sq Ft
$170/Sq Ft
Est. Value
About This Home
This home is located at 327 Front St, Waterloo, IL 62298 and is currently estimated at $249,912, approximately $169 per square foot. 327 Front St is a home located in Monroe County with nearby schools including W J Zahnow Elementary School, Gardner Elementary School, and Rogers Elementary School.
Ownership History
Date
Name
Owned For
Owner Type
Purchase Details
Closed on
Mar 4, 2024
Sold by
Revocable Living Trust
Bought by
Nilges Paul H and Nilges Emelie K
Current Estimated Value
Home Financials for this Owner
Home Financials are based on the most recent Mortgage that was taken out on this home.
Original Mortgage
$120,000
Outstanding Balance
$117,003
Interest Rate
6.6%
Mortgage Type
New Conventional
Estimated Equity
$132,909
Create a Home Valuation Report for This Property
The Home Valuation Report is an in-depth analysis detailing your home's value as well as a comparison with similar homes in the area
Purchase History
| Date | Buyer | Sale Price | Title Company |
|---|---|---|---|
| Nilges Paul H | $124,000 | None Listed On Document | |
| Nilges Paul H | $41,000 | None Listed On Document | |
| Nilges Paul H | -- | None Listed On Document |
Source: Public Records
Mortgage History
| Date | Status | Borrower | Loan Amount |
|---|---|---|---|
| Open | Nilges Paul H | $120,000 |
Source: Public Records
Tax History
| Year | Tax Paid | Tax Assessment Tax Assessment Total Assessment is a certain percentage of the fair market value that is determined by local assessors to be the total taxable value of land and additions on the property. | Land | Improvement |
|---|---|---|---|---|
| 2024 | $4,096 | $75,194 | $17,795 | $57,399 |
| 2023 | $3,784 | $66,200 | $16,310 | $49,890 |
| 2022 | $3,796 | $65,570 | $16,470 | $49,100 |
| 2021 | $3,658 | $62,160 | $13,980 | $48,180 |
| 2020 | $3,681 | $61,040 | $13,980 | $47,060 |
| 2019 | $3,623 | $59,510 | $13,980 | $45,530 |
| 2018 | $3,506 | $56,230 | $12,660 | $43,570 |
| 2017 | $3,399 | $57,242 | $12,888 | $44,354 |
| 2016 | $0 | $55,930 | $12,350 | $43,580 |
| 2015 | $2,988 | $51,030 | $13,750 | $37,280 |
| 2014 | $2,993 | $52,870 | $13,750 | $39,120 |
| 2012 | -- | $59,950 | $19,510 | $40,440 |
Source: Public Records
Map
Nearby Homes
Your Personal Tour Guide
Ask me questions while you tour the home.