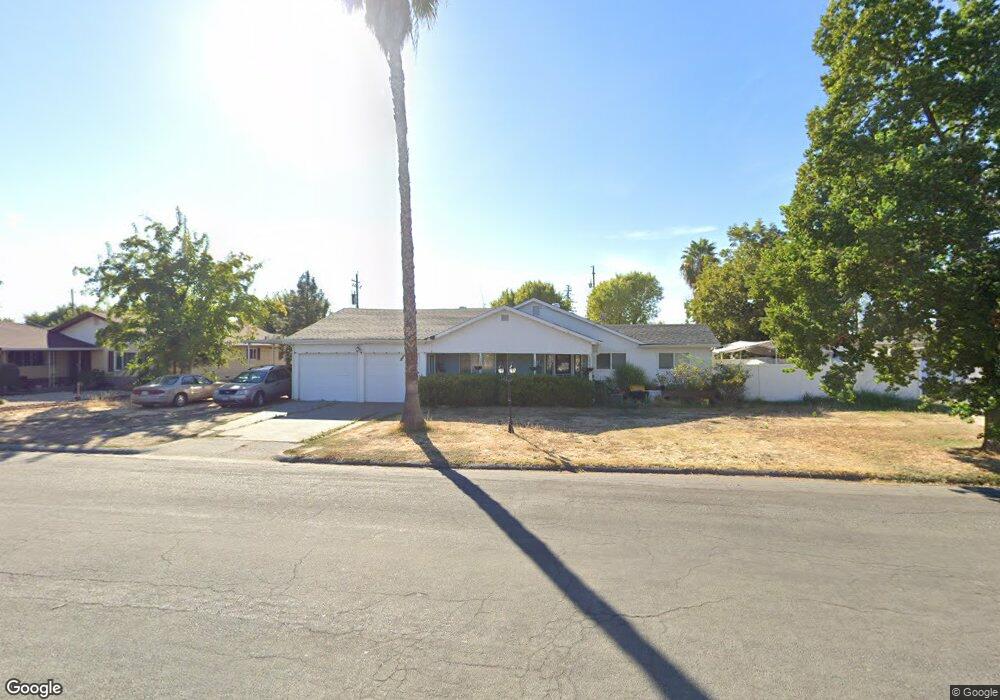
327 N Culver St Willows, CA 95988
Estimated Value: $269,414 - $327,000
2
Beds
1
Bath
1,276
Sq Ft
$232/Sq Ft
Est. Value
About This Home
This home is located at 327 N Culver St, Willows, CA 95988 and is currently estimated at $296,604, approximately $232 per square foot. 327 N Culver St is a home located in Glenn County with nearby schools including Murdock Elementary School, Willows Intermediate School, and Willows High School.
Ownership History
Date
Name
Owned For
Owner Type
Purchase Details
Closed on
May 23, 2025
Sold by
Christy Family Limited Partnership
Bought by
Leos Gabriel Hernandez and Vazquez Ernestina Zenaida
Current Estimated Value
Home Financials for this Owner
Home Financials are based on the most recent Mortgage that was taken out on this home.
Original Mortgage
$303,030
Outstanding Balance
$301,990
Interest Rate
6.81%
Mortgage Type
New Conventional
Estimated Equity
-$5,386
Purchase Details
Closed on
May 4, 2018
Sold by
C3d California Properties Unit C Llc
Bought by
Christy Family Limited Partnership
Purchase Details
Closed on
Feb 23, 2017
Sold by
Hyalite Investments Inc
Bought by
C3d California Properties Llc
Purchase Details
Closed on
Aug 9, 2016
Sold by
Townley Jack and Townley Patricia
Bought by
Hyalite Investments Inc
Create a Home Valuation Report for This Property
The Home Valuation Report is an in-depth analysis detailing your home's value as well as a comparison with similar homes in the area
Home Values in the Area
Average Home Value in this Area
Purchase History
| Date | Buyer | Sale Price | Title Company |
|---|---|---|---|
| Leos Gabriel Hernandez | $300,000 | Placer Title | |
| Christy Family Limited Partnership | -- | Placer Title Co | |
| C3d California Properties Llc | $128,727 | None Available | |
| Hyalite Investments Inc | $109,700 | None Available |
Source: Public Records
Mortgage History
| Date | Status | Borrower | Loan Amount |
|---|---|---|---|
| Open | Leos Gabriel Hernandez | $303,030 |
Source: Public Records
Tax History
| Year | Tax Paid | Tax Assessment Tax Assessment Total Assessment is a certain percentage of the fair market value that is determined by local assessors to be the total taxable value of land and additions on the property. | Land | Improvement |
|---|---|---|---|---|
| 2025 | $2,834 | $149,245 | $40,617 | $108,628 |
| 2024 | $2,834 | $146,320 | $39,821 | $106,499 |
| 2023 | $2,331 | $143,452 | $39,041 | $104,411 |
| 2022 | $2,219 | $140,640 | $38,276 | $102,364 |
| 2021 | $2,121 | $137,883 | $37,526 | $100,357 |
| 2020 | $2,024 | $136,470 | $37,142 | $99,328 |
| 2019 | $2,014 | $133,795 | $36,414 | $97,381 |
| 2018 | $1,963 | $131,172 | $35,700 | $95,472 |
| 2017 | $1,741 | $109,000 | $35,000 | $74,000 |
| 2016 | $1,667 | $107,934 | $28,698 | $79,236 |
| 2015 | $1,651 | $106,313 | $28,267 | $78,046 |
| 2014 | $1,637 | $105,000 | $28,000 | $77,000 |
Source: Public Records
Map
Nearby Homes
- 309 N Merrill Ave
- 1035 W Walnut St
- 107 N Crawford St
- 630 Jefferson St
- 650 Pacific Ave
- 151 S Murdock Ave
- 1165 Southgate Dr
- 205 N Shasta St
- 151 N Shasta St
- 159 159 S Shasta St
- 159 S Shasta St
- 447 S Marshall Ave
- 461 El Dorado Ave
- 537 S Plumas St
- 609 S Lassen St
- 421 5th St
- 939 Elm St
- 629 S Murdock Ave
- 0 5th St
- 266 S Yolo St
- 315 N Culver St
- 910 W Wood St
- 930 W Wood St
- 929 W Willow St
- 920 W Wood St
- 0 W Wood St
- 844 W Wood St
- 918 W Willow St
- 277 N Culver St
- 907 W Wood St Unit 909
- 805 W Willow St Unit 815
- 251 N Culver St
- 240 N Crawford St
- 411 Adams St
- 280 N Culver St
- 235 N Culver St
- 436 Jefferson St
- 226 N Crawford St
- 419 Adams St
- 335 N Crawford St
Your Personal Tour Guide
Ask me questions while you tour the home.