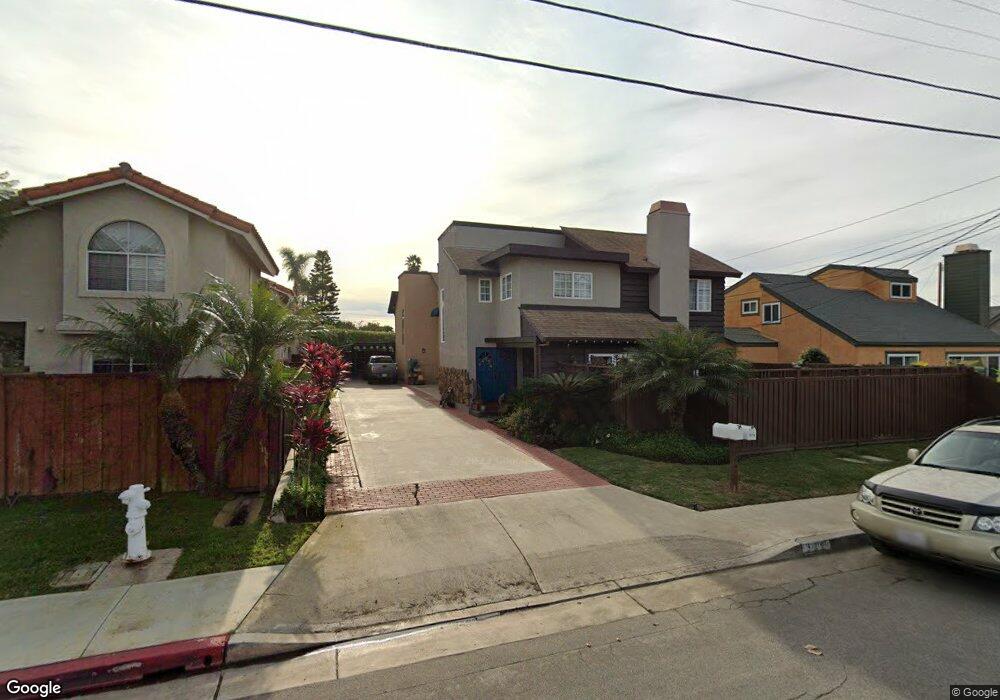
327 Ogle St Costa Mesa, CA 92627
Downtown Costa Mesa NeighborhoodEstimated Value: $1,021,000 - $1,434,000
3
Beds
2
Baths
1,569
Sq Ft
$821/Sq Ft
Est. Value
About This Home
This home is located at 327 Ogle St, Costa Mesa, CA 92627 and is currently estimated at $1,287,952, approximately $820 per square foot. 327 Ogle St is a home located in Orange County with nearby schools including Newport Heights Elementary, Horace Ensign Intermediate School, and Newport Harbor High School.
Ownership History
Date
Name
Owned For
Owner Type
Purchase Details
Closed on
Jan 19, 2023
Sold by
Boldt Carolyn J
Bought by
Carolyn J Boldt Family Trust
Current Estimated Value
Purchase Details
Closed on
Sep 26, 2022
Sold by
Carolyn J Boldt Family Trust
Bought by
Boldt Carolyn J
Home Financials for this Owner
Home Financials are based on the most recent Mortgage that was taken out on this home.
Original Mortgage
$460,000
Interest Rate
5.55%
Mortgage Type
New Conventional
Purchase Details
Closed on
Dec 20, 2006
Sold by
Boldt Carolyn June and Boldt Carolyn J
Bought by
Boldt Carolyn J
Purchase Details
Closed on
Dec 8, 1998
Sold by
Boldt Gunter E and Boldt Isabel J
Bought by
Boldt Carolyn J
Home Financials for this Owner
Home Financials are based on the most recent Mortgage that was taken out on this home.
Original Mortgage
$170,000
Interest Rate
6.91%
Mortgage Type
Purchase Money Mortgage
Purchase Details
Closed on
Sep 21, 1995
Sold by
Boldt Gunter E and Boldt Gunter Eugene
Bought by
Boldt Gunter E and Boldt Isabel J
Create a Home Valuation Report for This Property
The Home Valuation Report is an in-depth analysis detailing your home's value as well as a comparison with similar homes in the area
Home Values in the Area
Average Home Value in this Area
Purchase History
| Date | Buyer | Sale Price | Title Company |
|---|---|---|---|
| Carolyn J Boldt Family Trust | -- | -- | |
| Boldt Carolyn J | -- | Pacific Coast Title | |
| Boldt Carolyn J | -- | None Available | |
| Boldt Carolyn J | -- | Gateway Title Company | |
| Boldt Gunter E | -- | -- |
Source: Public Records
Mortgage History
| Date | Status | Borrower | Loan Amount |
|---|---|---|---|
| Previous Owner | Boldt Carolyn J | $460,000 | |
| Previous Owner | Boldt Carolyn J | $170,000 |
Source: Public Records
Tax History
| Year | Tax Paid | Tax Assessment Tax Assessment Total Assessment is a certain percentage of the fair market value that is determined by local assessors to be the total taxable value of land and additions on the property. | Land | Improvement |
|---|---|---|---|---|
| 2025 | $4,160 | $312,764 | $135,077 | $177,687 |
| 2024 | $4,160 | $306,632 | $132,429 | $174,203 |
| 2023 | $3,993 | $300,620 | $129,832 | $170,788 |
| 2022 | $3,814 | $294,726 | $127,286 | $167,440 |
| 2021 | $3,676 | $288,948 | $124,791 | $164,157 |
| 2020 | $3,626 | $285,986 | $123,512 | $162,474 |
| 2019 | $3,547 | $280,379 | $121,090 | $159,289 |
| 2018 | $3,475 | $274,882 | $118,716 | $156,166 |
| 2017 | $3,419 | $269,493 | $116,389 | $153,104 |
| 2016 | $3,349 | $264,209 | $114,107 | $150,102 |
| 2015 | $3,316 | $260,241 | $112,393 | $147,848 |
| 2014 | $3,243 | $255,144 | $110,192 | $144,952 |
Source: Public Records
Map
Nearby Homes
- 766 Tustin Ave Unit 5
- 469 Lenwood Cir
- 1581 Orange Ave Unit B
- 308 E 18th St
- 539 Tustin Ave
- 268 E 18th St
- 600 Powell Place
- 521 Westminster Ave
- 412 Magnolia St
- 1532 Maxwell Way
- 3209 Clay St
- 143 Mercer Way
- 1173 Winslow Ln
- 1683 Superior Ave
- 2127 Cresta Dr
- 425 Tustin Ave
- 639 Channel Way
- 1658 Topanga
- 1650 Topanga
- 405 El Modena Ave
Your Personal Tour Guide
Ask me questions while you tour the home.