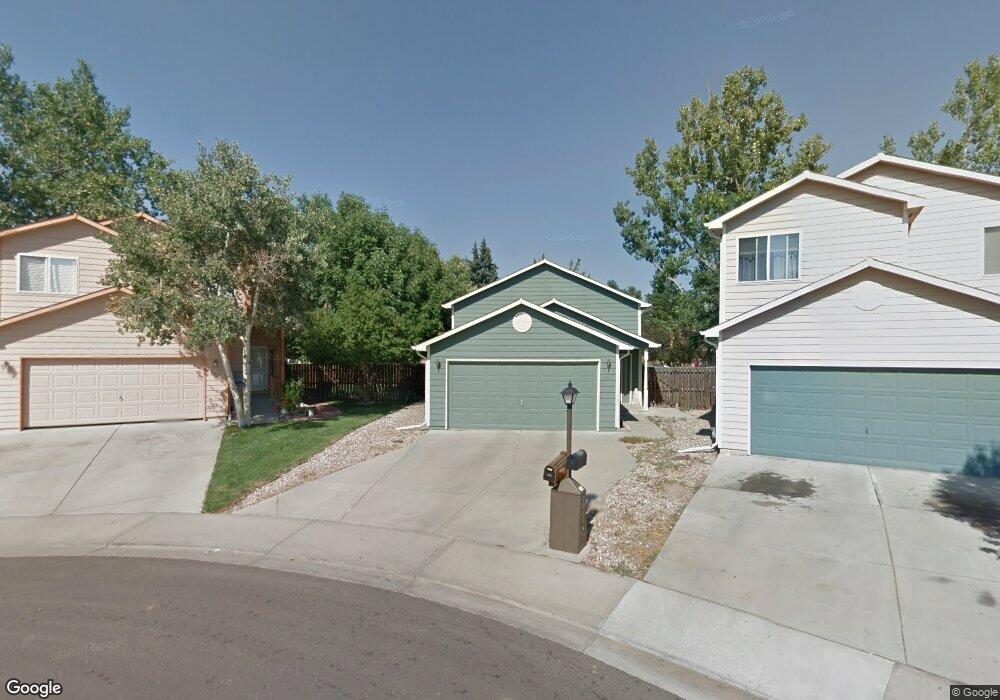
327 Wadsworth Cir Longmont, CO 80504
Kensington NeighborhoodEstimated Value: $474,000 - $510,000
4
Beds
3
Baths
1,122
Sq Ft
$434/Sq Ft
Est. Value
About This Home
This home is located at 327 Wadsworth Cir, Longmont, CO 80504 and is currently estimated at $486,949, approximately $434 per square foot. 327 Wadsworth Cir is a home located in Boulder County with nearby schools including Rocky Mountain Elementary School, Trail Ridge Middle School, and Skyline High School.
Ownership History
Date
Name
Owned For
Owner Type
Purchase Details
Closed on
Sep 26, 2001
Sold by
Melvin David Anthony and Fordham Jennifer F
Bought by
Melvin David A
Current Estimated Value
Purchase Details
Closed on
Mar 26, 1999
Sold by
Keslin Robert J and Keslin Dawn A
Bought by
Melvin David A
Home Financials for this Owner
Home Financials are based on the most recent Mortgage that was taken out on this home.
Original Mortgage
$110,000
Interest Rate
6.69%
Purchase Details
Closed on
Apr 22, 1994
Sold by
Platte River Group
Bought by
Keslin Robert J
Home Financials for this Owner
Home Financials are based on the most recent Mortgage that was taken out on this home.
Original Mortgage
$101,800
Interest Rate
8.03%
Purchase Details
Closed on
Jun 8, 1993
Bought by
Melvin David A
Create a Home Valuation Report for This Property
The Home Valuation Report is an in-depth analysis detailing your home's value as well as a comparison with similar homes in the area
Home Values in the Area
Average Home Value in this Area
Purchase History
| Date | Buyer | Sale Price | Title Company |
|---|---|---|---|
| Melvin David A | -- | -- | |
| Melvin David A | $157,500 | Land Title | |
| Keslin Robert J | $127,450 | -- | |
| Melvin David A | $299,500 | -- |
Source: Public Records
Mortgage History
| Date | Status | Borrower | Loan Amount |
|---|---|---|---|
| Previous Owner | Melvin David A | $110,000 | |
| Previous Owner | Keslin Robert J | $101,800 |
Source: Public Records
Tax History Compared to Growth
Tax History
| Year | Tax Paid | Tax Assessment Tax Assessment Total Assessment is a certain percentage of the fair market value that is determined by local assessors to be the total taxable value of land and additions on the property. | Land | Improvement |
|---|---|---|---|---|
| 2025 | $2,931 | $31,863 | $9,975 | $21,888 |
| 2024 | $2,931 | $31,863 | $9,975 | $21,888 |
| 2023 | $2,891 | $30,646 | $10,941 | $23,390 |
| 2022 | $2,554 | $25,806 | $7,708 | $18,098 |
| 2021 | $2,587 | $26,548 | $7,929 | $18,619 |
| 2020 | $2,231 | $22,966 | $6,721 | $16,245 |
| 2019 | $2,196 | $22,966 | $6,721 | $16,245 |
| 2018 | $1,940 | $20,426 | $5,688 | $14,738 |
| 2017 | $1,914 | $22,582 | $6,288 | $16,294 |
| 2016 | $1,758 | $18,396 | $5,174 | $13,222 |
| 2015 | $1,676 | $15,275 | $5,015 | $10,260 |
| 2014 | $1,427 | $15,275 | $5,015 | $10,260 |
Source: Public Records
Map
Nearby Homes
- 405 Elliott St
- 262 E 5th Ave
- 247 Wadsworth Cir
- 631 Buchanan Ln
- 104 Rothrock Place
- 36 Reed Place
- 29 Marshall Place
- 225 E 8th Ave Unit E20
- 225 E 8th Ave Unit A2
- 225 E 8th Ave Unit E10
- 448 Morgan Rd
- 729 Brookside Dr
- 741 Elliott St
- 618 Silver Star Ct
- 815 Hilltop St
- 28691 E 8th Ave
- 756 Brookside Dr
- 613 Rider Ridge Dr
- 811 Brookside Dr
- 641 Martin St
- 329 Wadsworth Cir
- 325 Wadsworth Cir
- 35 Alpine Place
- 34 Alpine Place
- 343 Wadsworth Cir
- 321 Wadsworth Cir
- 347 Wadsworth Cir
- 317 Wadsworth Cir
- 437 Alpine St
- 33 Alpine Place
- 431 Alpine St
- 279 Caywood Ct
- 351 Wadsworth Cir
- 313 Wadsworth Cir
- 32 Alpine Place
- 346 Wadsworth Cir
- 445 Alpine St
- 355 Wadsworth Cir
- 425 Alpine St
- 307 E 5th Ave