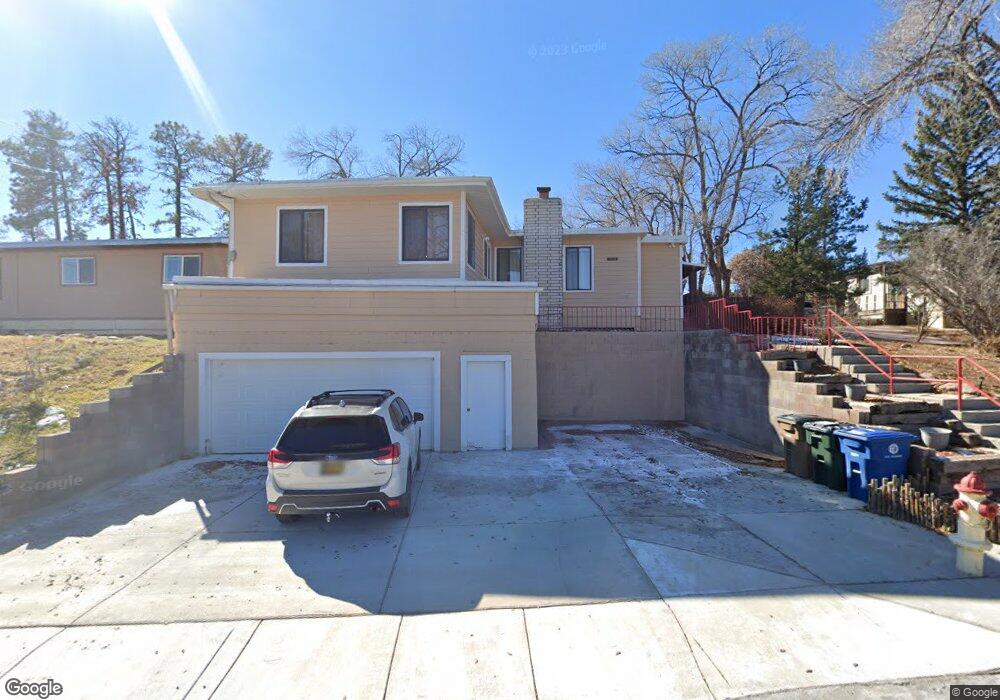
3273 Walnut St Los Alamos, NM 87544
Estimated Value: $375,000 - $473,000
3
Beds
1
Bath
1,437
Sq Ft
$295/Sq Ft
Est. Value
About This Home
This home is located at 3273 Walnut St, Los Alamos, NM 87544 and is currently estimated at $423,864, approximately $294 per square foot. 3273 Walnut St is a home located in Los Alamos County with nearby schools including Aspen Elementary School, Los Alamos Middle School, and Los Alamos High School.
Ownership History
Date
Name
Owned For
Owner Type
Purchase Details
Closed on
Jun 20, 2023
Sold by
Mellon Vince L and Mellon Elizabeth J
Bought by
Theye Nathan A and Theye Rebecca M
Current Estimated Value
Home Financials for this Owner
Home Financials are based on the most recent Mortgage that was taken out on this home.
Original Mortgage
$420,000
Outstanding Balance
$402,933
Interest Rate
4%
Mortgage Type
New Conventional
Estimated Equity
$20,931
Purchase Details
Closed on
May 11, 2012
Sold by
Melton Vince L
Bought by
Melton Vince L and Melton Elizabeth J
Home Financials for this Owner
Home Financials are based on the most recent Mortgage that was taken out on this home.
Original Mortgage
$172,798
Interest Rate
4.02%
Mortgage Type
VA
Purchase Details
Closed on
Jan 22, 2010
Sold by
Harden Troy A and Harden Kelly L
Bought by
Melton Vince L
Home Financials for this Owner
Home Financials are based on the most recent Mortgage that was taken out on this home.
Original Mortgage
$171,478
Interest Rate
4.83%
Mortgage Type
VA
Create a Home Valuation Report for This Property
The Home Valuation Report is an in-depth analysis detailing your home's value as well as a comparison with similar homes in the area
Home Values in the Area
Average Home Value in this Area
Purchase History
| Date | Buyer | Sale Price | Title Company |
|---|---|---|---|
| Theye Nathan A | -- | None Listed On Document | |
| Melton Vince L | -- | None Available | |
| Melton Vince L | -- | -- |
Source: Public Records
Mortgage History
| Date | Status | Borrower | Loan Amount |
|---|---|---|---|
| Open | Theye Nathan A | $420,000 | |
| Previous Owner | Melton Vince L | $172,798 | |
| Previous Owner | Melton Vince L | $171,478 |
Source: Public Records
Tax History Compared to Growth
Tax History
| Year | Tax Paid | Tax Assessment Tax Assessment Total Assessment is a certain percentage of the fair market value that is determined by local assessors to be the total taxable value of land and additions on the property. | Land | Improvement |
|---|---|---|---|---|
| 2025 | $3,072 | $134,270 | $36,150 | $98,120 |
| 2024 | $3,072 | $130,360 | $35,460 | $94,900 |
| 2023 | $1,431 | $59,600 | $22,250 | $37,350 |
| 2022 | $1,398 | $57,870 | $21,910 | $35,960 |
| 2021 | $1,353 | $56,180 | $21,580 | $34,600 |
| 2020 | $1,338 | $54,550 | $21,300 | $33,250 |
| 2019 | $1,320 | $52,970 | $20,870 | $32,100 |
| 2018 | $1,290 | $51,430 | $20,440 | $30,990 |
| 2017 | $1,260 | $49,930 | $20,000 | $29,930 |
| 2016 | $1,181 | $48,470 | $20,000 | $28,470 |
| 2015 | $1,155 | $47,270 | $19,540 | $27,730 |
| 2014 | $1,055 | $46,720 | $19,540 | $27,180 |
| 2013 | $1,176 | $52,460 | $22,490 | $29,970 |
| 2011 | $1,175 | $54,520 | $23,190 | $31,330 |
Source: Public Records
Map
Nearby Homes
- 3271 Walnut St
- 3242 Walnut St Unit D
- 3216 Villa St
- 2241 34th St
- 2296 36th St Unit A
- 2819 Villa St Unit A & B
- 3496 Questa Dr
- 3460 Pueblo Dr
- 3546 Questa Dr
- 4039 Sycamore St
- 4039 Sycamore St Unit b
- 2176 La Tierra Rd
- 4131 Arkansas Ave Unit D
- 1332 La Mirada Cir
- 3511 Arizona Ave
- 1970 Camino Redondo
- 4226 Alabama Ave
- 1511 43rd St Unit A and B
- 2356 45th St Unit A
- 1913 Spruce St
- 3273 Walnut St
- 3273 Walnut St Unit A
- 3273 Walnut St Unit B
- 3263 Walnut St
- 3263 Walnut St Unit Walnut
- 3283 Walnut St
- 3283 Walnut St
- 3262 Walnut St
- 3262 Walnut St
- 3262 Walnut St
- 3262 Walnut St
- 3262 Walnut St Unit C
- 3283 B Walnut
- 3282 Walnut St
- 3282 Walnut St
- 3282 Walnut St
- 3282 Walnut St
- 3282 Walnut St Unit C
- 3272 Walnut St
- 3272 Walnut St