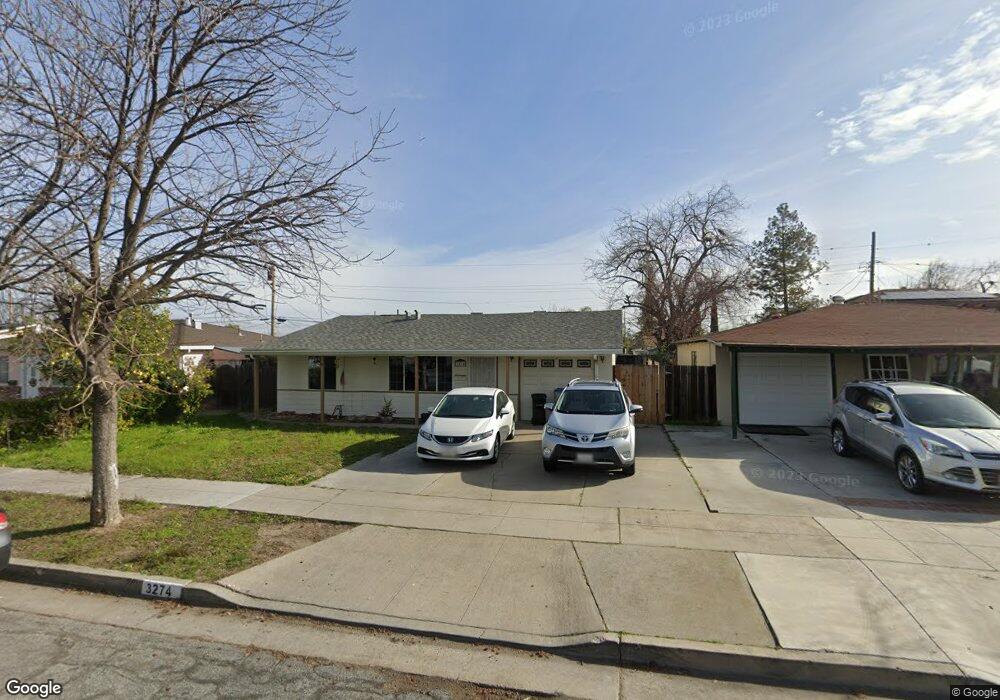
3274 Manda Dr San Jose, CA 95124
Doerr-Steindorf NeighborhoodEstimated Value: $1,271,000 - $1,443,000
3
Beds
1
Bath
1,060
Sq Ft
$1,283/Sq Ft
Est. Value
About This Home
This home is located at 3274 Manda Dr, San Jose, CA 95124 and is currently estimated at $1,360,280, approximately $1,283 per square foot. 3274 Manda Dr is a home located in Santa Clara County with nearby schools including Branham High School, Sartorette Charter School, and Fammatre Elementary School.
Ownership History
Date
Name
Owned For
Owner Type
Purchase Details
Closed on
Feb 8, 2012
Sold by
Flores Javier and Flores Maria T
Bought by
Flores Javier and Flores Maria T
Current Estimated Value
Purchase Details
Closed on
Nov 21, 2002
Sold by
Chacon Louis M and Chacon Cynthia M
Bought by
Flores Javier and Flores Maria T
Home Financials for this Owner
Home Financials are based on the most recent Mortgage that was taken out on this home.
Original Mortgage
$243,000
Outstanding Balance
$102,530
Interest Rate
6.12%
Estimated Equity
$1,257,750
Purchase Details
Closed on
Jul 28, 2001
Sold by
Chacon Louis M and Chacon Cynthia M
Bought by
Chacon Louis M and Chacon Cynthia M
Purchase Details
Closed on
Oct 1, 1999
Sold by
Joe Caradonna
Bought by
Chacon Louis M and Chacon Cynthia M
Home Financials for this Owner
Home Financials are based on the most recent Mortgage that was taken out on this home.
Original Mortgage
$230,000
Interest Rate
7.76%
Mortgage Type
Balloon
Purchase Details
Closed on
May 21, 1997
Sold by
Simoes Kelly E and Simoes Jeannine M
Bought by
Caradonna Joe and Caradonna Karyn
Home Financials for this Owner
Home Financials are based on the most recent Mortgage that was taken out on this home.
Original Mortgage
$209,000
Interest Rate
8.13%
Create a Home Valuation Report for This Property
The Home Valuation Report is an in-depth analysis detailing your home's value as well as a comparison with similar homes in the area
Home Values in the Area
Average Home Value in this Area
Purchase History
| Date | Buyer | Sale Price | Title Company |
|---|---|---|---|
| Flores Javier | -- | None Available | |
| Flores Javier | $393,000 | Chicago Title | |
| Chacon Louis M | -- | -- | |
| Chacon Louis M | $287,500 | Old Republic Title Company | |
| Caradonna Joe | $222,500 | Old Republic Title Company |
Source: Public Records
Mortgage History
| Date | Status | Borrower | Loan Amount |
|---|---|---|---|
| Open | Flores Javier | $243,000 | |
| Previous Owner | Chacon Louis M | $230,000 | |
| Previous Owner | Caradonna Joe | $209,000 | |
| Closed | Chacon Louis M | $57,500 |
Source: Public Records
Tax History
| Year | Tax Paid | Tax Assessment Tax Assessment Total Assessment is a certain percentage of the fair market value that is determined by local assessors to be the total taxable value of land and additions on the property. | Land | Improvement |
|---|---|---|---|---|
| 2025 | $8,469 | $569,175 | $341,511 | $227,664 |
| 2024 | $8,469 | $558,015 | $334,815 | $223,200 |
| 2023 | $8,382 | $547,074 | $328,250 | $218,824 |
| 2022 | $8,238 | $536,348 | $321,814 | $214,534 |
| 2021 | $8,047 | $525,832 | $315,504 | $210,328 |
| 2020 | $7,676 | $520,441 | $312,269 | $208,172 |
| 2019 | $7,567 | $510,238 | $306,147 | $204,091 |
| 2018 | $7,359 | $500,235 | $300,145 | $200,090 |
| 2017 | $7,188 | $490,427 | $294,260 | $196,167 |
| 2016 | $6,848 | $480,812 | $288,491 | $192,321 |
| 2015 | $6,762 | $473,591 | $284,158 | $189,433 |
| 2014 | $6,247 | $464,315 | $278,592 | $185,723 |
Source: Public Records
Map
Nearby Homes
- 3210 Rama Dr
- 1779 Foxworthy Ave
- 3678 Julio Ave
- 1795 Foxworthy Ave
- 1658 N Pole Place Unit 1
- 3609 Cefalu Dr
- 3689 Woodford Dr
- 1653 Hillsdale Ave Unit 4
- 2872 Manda Dr
- 1743 Willow Creek Ct
- 1708 Hallmark Ln
- 1775 Wema Way
- 1695 Grizilo Dr
- 2823 Quinto Way
- 2881 Meridian Ave Unit 104
- 2881 Meridian Ave Unit 234
- 2881 Meridian Ave Unit 217
- 1800 Donna Ln
- 2812 Paseo Ln Unit 2812
- 3852 Ross Ave
Your Personal Tour Guide
Ask me questions while you tour the home.