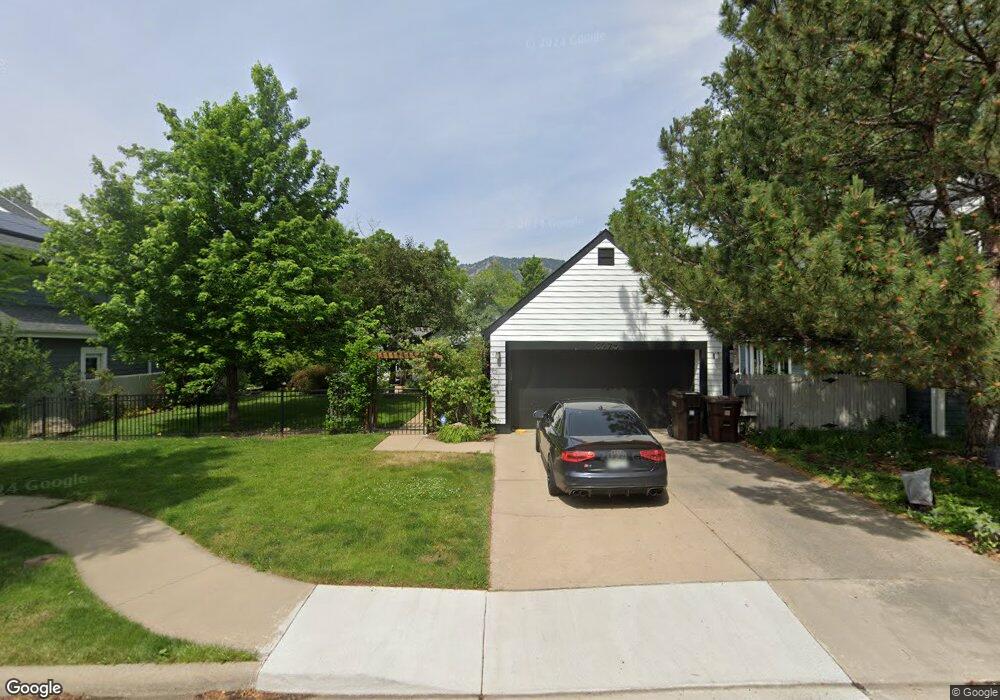
3275 15th St Boulder, CO 80304
Central Boulder NeighborhoodEstimated Value: $1,130,198 - $1,367,000
3
Beds
2
Baths
1,416
Sq Ft
$893/Sq Ft
Est. Value
About This Home
This home is located at 3275 15th St, Boulder, CO 80304 and is currently estimated at $1,264,050, approximately $892 per square foot. 3275 15th St is a home located in Boulder County with nearby schools including Foothill Elementary School, Casey Middle School, and Boulder High School.
Ownership History
Date
Name
Owned For
Owner Type
Purchase Details
Closed on
Dec 29, 2015
Sold by
Steele Emily H and Estate Of Mark W Steele
Bought by
Barbara Gold Orman 2015 Irrevocable Trus
Current Estimated Value
Purchase Details
Closed on
Aug 21, 1996
Sold by
Griff Bob P and Griff Deborah D
Bought by
Steele Mark W
Home Financials for this Owner
Home Financials are based on the most recent Mortgage that was taken out on this home.
Original Mortgage
$90,000
Interest Rate
8.42%
Purchase Details
Closed on
May 18, 1989
Bought by
Orman Barbara Gold 2015 Irrevocable Trst
Purchase Details
Closed on
Jan 4, 1983
Bought by
Orman Barbara Gold 2015 Irrevocable Trst
Purchase Details
Closed on
Jan 13, 1982
Bought by
Orman Barbara Gold 2015 Irrevocable Trst
Create a Home Valuation Report for This Property
The Home Valuation Report is an in-depth analysis detailing your home's value as well as a comparison with similar homes in the area
Home Values in the Area
Average Home Value in this Area
Purchase History
| Date | Buyer | Sale Price | Title Company |
|---|---|---|---|
| Barbara Gold Orman 2015 Irrevocable Trus | $663,000 | None Available | |
| Steele Mark W | $279,900 | -- | |
| Orman Barbara Gold 2015 Irrevocable Trst | $137,500 | -- | |
| Orman Barbara Gold 2015 Irrevocable Trst | $107,500 | -- | |
| Orman Barbara Gold 2015 Irrevocable Trst | -- | -- |
Source: Public Records
Mortgage History
| Date | Status | Borrower | Loan Amount |
|---|---|---|---|
| Previous Owner | Steele Mark W | $90,000 |
Source: Public Records
Tax History
| Year | Tax Paid | Tax Assessment Tax Assessment Total Assessment is a certain percentage of the fair market value that is determined by local assessors to be the total taxable value of land and additions on the property. | Land | Improvement |
|---|---|---|---|---|
| 2025 | $7,028 | $74,476 | $66,613 | $7,863 |
| 2024 | $7,028 | $74,476 | $66,613 | $7,863 |
| 2023 | $6,906 | $79,965 | $70,538 | $13,112 |
| 2022 | $6,009 | $64,705 | $53,244 | $11,461 |
| 2021 | $5,730 | $66,566 | $54,776 | $11,790 |
| 2020 | $5,135 | $58,988 | $47,190 | $11,798 |
| 2019 | $5,056 | $58,988 | $47,190 | $11,798 |
| 2018 | $4,620 | $53,287 | $42,264 | $11,023 |
| 2017 | $4,475 | $58,912 | $46,725 | $12,187 |
| 2016 | $4,544 | $52,488 | $35,820 | $16,668 |
| 2015 | $3,650 | $43,613 | $22,129 | $21,484 |
| 2014 | $3,065 | $43,613 | $22,129 | $21,484 |
Source: Public Records
Map
Nearby Homes
- 3315 Broadway St
- 3319 Broadway
- 3217 Broadway St
- 1737 Hawthorn Place
- 1717 Iris Ave
- 1525 Jennine Place
- 1400 Kalmia Ave
- 3515 Broadway St Unit B
- 1070 Juniper Ave
- 1023 Forest Ave
- 1930 Grape Ave
- 1845 Iris Ave
- 1805 Forest Ave
- 3135 11th St
- 3560 16th St
- 1850 Iris Ave
- 1237 Elder Ave Unit 1
- 3086 11th St
- 3275 19th St
- 865 Grape Ave Unit X
- 3265 15th St
- 1480 Hawthorn Ave
- 1440 Hawthorn Ave
- 3245 15th St
- 3255 15th St
- 3286 Hawthorne Hollow
- 1420 Hawthorn Ave
- 3239 15th St
- 3274 Hawthorne Hollow
- 1500 Hawthorn Ave
- 3266 Hawthorne Hollow
- 3270 15th St
- 3260 15th St
- 3293 Hawthorne Hollow
- 3250 15th St
- 1520 Hawthorn Ave
- 1435 Hawthorn Ave
- 1445 Hawthorn Ave
- 3215 15th St
- 3225 15th St
Your Personal Tour Guide
Ask me questions while you tour the home.