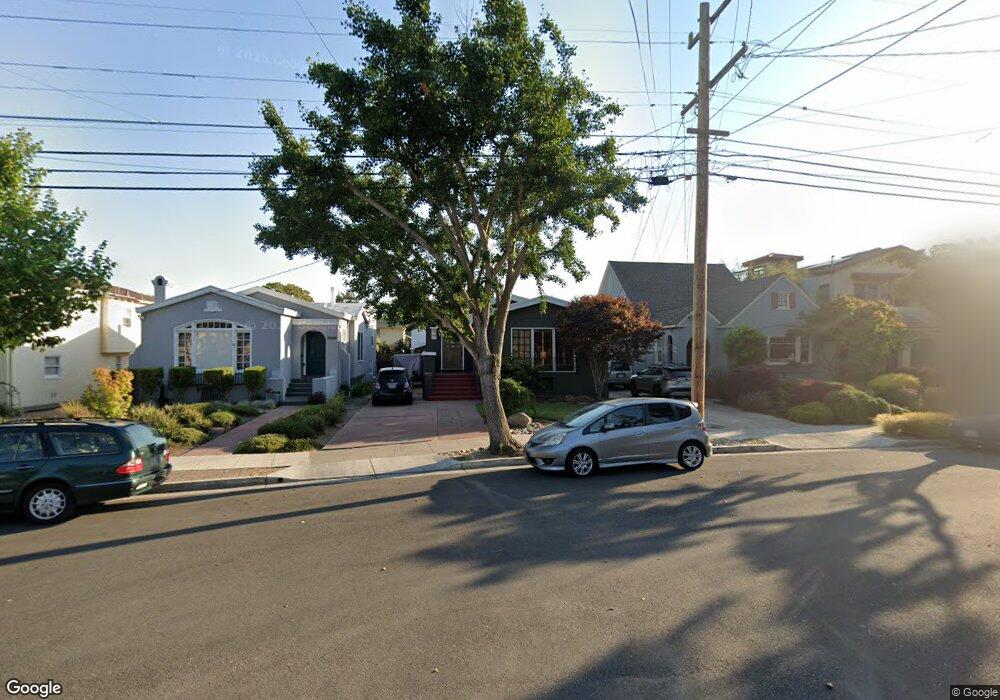
3278 Thompson Ave Alameda, CA 94501
Downtown Alameda NeighborhoodEstimated Value: $1,631,000 - $1,807,000
3
Beds
2
Baths
2,618
Sq Ft
$643/Sq Ft
Est. Value
About This Home
This home is located at 3278 Thompson Ave, Alameda, CA 94501 and is currently estimated at $1,683,238, approximately $642 per square foot. 3278 Thompson Ave is a home located in Alameda County with nearby schools including Edison Elementary School, Lincoln Middle School, and Alameda High School.
Ownership History
Date
Name
Owned For
Owner Type
Purchase Details
Closed on
Jan 5, 2016
Sold by
Mclens John P and Nelson Dana R
Bought by
Mclens John P and Nelson Dana R
Current Estimated Value
Home Financials for this Owner
Home Financials are based on the most recent Mortgage that was taken out on this home.
Original Mortgage
$417,000
Interest Rate
3.92%
Mortgage Type
New Conventional
Purchase Details
Closed on
Aug 22, 2002
Sold by
Nelson Rhea C and Robert & Rhea Nelson Revocable
Bought by
Mclens John Patrick and Nelson Dana Rhea
Home Financials for this Owner
Home Financials are based on the most recent Mortgage that was taken out on this home.
Original Mortgage
$200,000
Interest Rate
6.29%
Purchase Details
Closed on
Jun 8, 1998
Sold by
Nelson Robert W and Nelson Rhea C
Bought by
Nelson Robert W and Nelson Rhea C
Create a Home Valuation Report for This Property
The Home Valuation Report is an in-depth analysis detailing your home's value as well as a comparison with similar homes in the area
Home Values in the Area
Average Home Value in this Area
Purchase History
| Date | Buyer | Sale Price | Title Company |
|---|---|---|---|
| Mclens John P | -- | Fidelity National Title Co | |
| Mclens John Patrick | $250,000 | First American Title Guarant | |
| Nelson Robert W | -- | -- |
Source: Public Records
Mortgage History
| Date | Status | Borrower | Loan Amount |
|---|---|---|---|
| Closed | Mclens John P | $417,000 | |
| Closed | Mclens John Patrick | $200,000 |
Source: Public Records
Tax History
| Year | Tax Paid | Tax Assessment Tax Assessment Total Assessment is a certain percentage of the fair market value that is determined by local assessors to be the total taxable value of land and additions on the property. | Land | Improvement |
|---|---|---|---|---|
| 2025 | $4,396 | $132,707 | $75,515 | $64,192 |
| 2024 | $4,396 | $129,968 | $74,034 | $62,934 |
| 2023 | $4,292 | $134,282 | $72,582 | $61,700 |
| 2022 | $4,222 | $124,650 | $71,160 | $60,490 |
| 2021 | $4,156 | $122,068 | $69,764 | $59,304 |
| 2020 | $4,117 | $127,745 | $69,049 | $58,696 |
| 2019 | $3,323 | $125,241 | $67,695 | $57,546 |
| 2018 | $3,261 | $122,786 | $66,368 | $56,418 |
| 2017 | $3,170 | $120,378 | $65,067 | $55,311 |
| 2016 | $3,147 | $118,018 | $63,791 | $54,227 |
| 2015 | $3,127 | $116,245 | $62,833 | $53,412 |
| 2014 | $2,997 | $113,968 | $61,602 | $52,366 |
Source: Public Records
Map
Nearby Homes
- 3248 Briggs Ave
- 1308 Court St
- 2932 Marina Dr
- 2608 Central Ave
- 1601 Broadway Unit 9
- 3090 Glascock St Unit 405
- 3090 Glascock St Unit 102
- 2417 Marti Rae Ct
- 2853 Regatta Dr Unit 179
- 3109 Elmwood Ave
- 827 34th Ave
- 1241 Park Ave
- 1024 50th Ave
- 2875 Glascock St Unit 209
- 1251 Park St
- 340 29th Ave Unit 204
- 2312 San Antonio Ave
- 3338 San Leandro St
- 1100 Park Ave
- 641 Centre Ct
- 3280 Thompson Ave
- 3274 Thompson Ave
- 3272 Thompson Ave
- 3284 Thompson Ave
- 3268 Thompson Ave
- 3286 Thompson Ave
- 3277 Garfield Ave
- 1615 Fernside Blvd
- 3281 Garfield Ave
- 3273 Garfield Ave
- 3283 Garfield Ave
- 3269 Garfield Ave
- 3264 Thompson Ave
- 3290 Thompson Ave
- 3287 Garfield Ave
- 3267 Garfield Ave
- 3279 Thompson Ave
- 3283 Thompson Ave
- 3287 Thompson Ave
- 3262 Thompson Ave
Your Personal Tour Guide
Ask me questions while you tour the home.