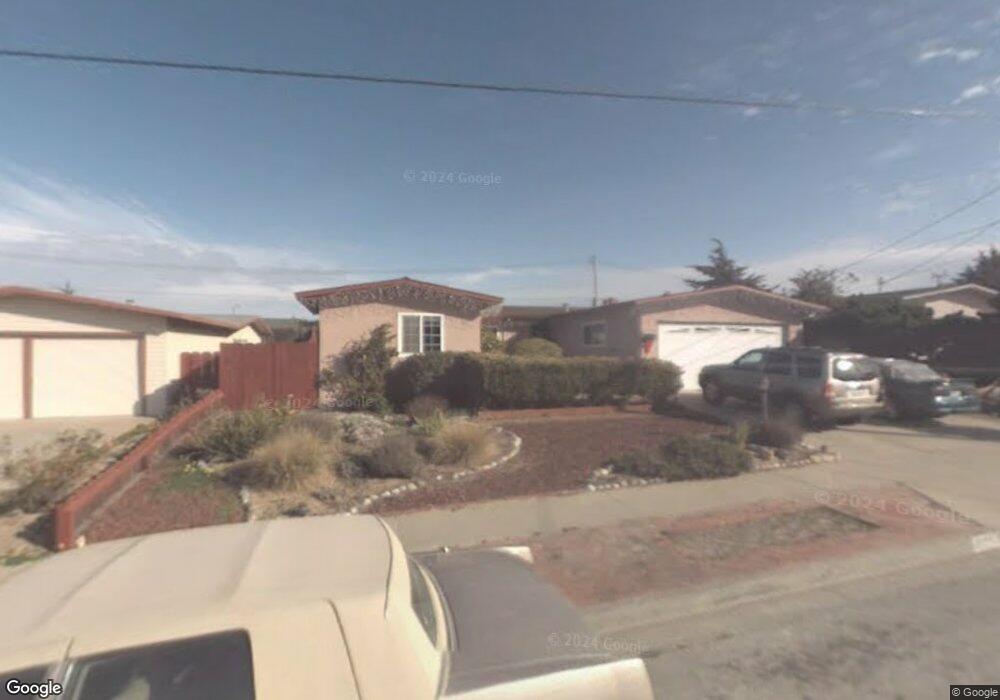
3279 Begonia Cir Marina, CA 93933
Estimated Value: $838,000 - $910,000
3
Beds
2
Baths
1,780
Sq Ft
$491/Sq Ft
Est. Value
About This Home
This home is located at 3279 Begonia Cir, Marina, CA 93933 and is currently estimated at $874,433, approximately $491 per square foot. 3279 Begonia Cir is a home located in Monterey County with nearby schools including Ione Olson Elementary School, Los Arboles Middle School, and Marina High School.
Ownership History
Date
Name
Owned For
Owner Type
Purchase Details
Closed on
Nov 25, 2020
Sold by
Krejsa Gary P and Krejsa Christine
Bought by
Krejsa Gary P and Krejsa Christine
Current Estimated Value
Home Financials for this Owner
Home Financials are based on the most recent Mortgage that was taken out on this home.
Original Mortgage
$355,750
Interest Rate
3%
Mortgage Type
New Conventional
Purchase Details
Closed on
Jan 4, 2020
Sold by
Krejsa Gary P and Krejsa Christine
Bought by
Krejsa Gary P and Krejsa Christine
Home Financials for this Owner
Home Financials are based on the most recent Mortgage that was taken out on this home.
Original Mortgage
$345,000
Interest Rate
3.6%
Mortgage Type
New Conventional
Purchase Details
Closed on
May 29, 2017
Sold by
Krejsa Gary P and Krejsa Christine
Bought by
Krejsa Gary P and Krejsa Christine
Create a Home Valuation Report for This Property
The Home Valuation Report is an in-depth analysis detailing your home's value as well as a comparison with similar homes in the area
Home Values in the Area
Average Home Value in this Area
Purchase History
| Date | Buyer | Sale Price | Title Company |
|---|---|---|---|
| Krejsa Gary P | -- | Amrock Llc | |
| Krejsa Gary P | -- | Amrock Llc | |
| Krejsa Gary P | -- | Amrock Inc | |
| Krejsa Gary P | -- | Amrock Inc | |
| Krejsa Gary P | -- | None Available | |
| Krejsa Gary P | -- | None Available |
Source: Public Records
Mortgage History
| Date | Status | Borrower | Loan Amount |
|---|---|---|---|
| Closed | Krejsa Gary P | $355,750 | |
| Closed | Krejsa Gary P | $345,000 |
Source: Public Records
Tax History Compared to Growth
Tax History
| Year | Tax Paid | Tax Assessment Tax Assessment Total Assessment is a certain percentage of the fair market value that is determined by local assessors to be the total taxable value of land and additions on the property. | Land | Improvement |
|---|---|---|---|---|
| 2025 | $3,059 | $280,382 | $76,548 | $203,834 |
| 2024 | $3,059 | $274,886 | $75,048 | $199,838 |
| 2023 | $3,030 | $269,497 | $73,577 | $195,920 |
| 2022 | $2,987 | $264,214 | $72,135 | $192,079 |
| 2021 | $2,863 | $259,034 | $70,721 | $188,313 |
| 2020 | $2,845 | $256,379 | $69,996 | $186,383 |
| 2019 | $2,971 | $251,353 | $68,624 | $182,729 |
| 2018 | $2,863 | $246,426 | $67,279 | $179,147 |
| 2017 | $2,577 | $241,595 | $65,960 | $175,635 |
| 2016 | $2,533 | $236,859 | $64,667 | $172,192 |
| 2015 | $2,494 | $233,302 | $63,696 | $169,606 |
| 2014 | $2,472 | $228,733 | $62,449 | $166,284 |
Source: Public Records
Map
Nearby Homes
- 3248 Fitzgerald Cir
- 162 Linde Cir
- 246 Cosky Dr
- 126 Cypress Lakes Ct
- 3145 Marina Dr
- 3137 Seacrest Ave Unit 17
- 221 Mortimers (Unit B) Ln
- 220 Mortimer Ln
- 337 Quebrada Del Mar Rd
- 3095 Marina Dr Unit 2
- 3095 Marina Dr Unit 30
- 3095 Marina Dr Unit 35
- 3128 Crescent Ave Unit 19
- 356 Reservation Rd Unit 50
- 356 Reservation Rd Unit 2
- 356 Reservation Rd Unit 90
- 356 Reservation Rd Unit 68
- 310 Carmel Ave
- 3141 Ocean Terrace
- 347 Carmel Ave Unit 15
- 3277 Begonia Cir
- 3281 Begonia Cir
- 230 Mcculloch Cir
- 3283 Begonia Cir
- 232 Mcculloch Cir
- 3275 Begonia Cir
- 228 Mcculloch Cir
- 3278 Begonia Cir
- 3276 Begonia Cir
- 3280 Begonia Cir
- 234 Mcculloch Cir
- 3273 Begonia Cir
- 3285 Begonia Cir
- 3271 Begonia Cir
- 3284 Begonia Cir
- 3282 Begonia Cir
- 229 Michael Dr
- 227 Michael Dr
- 236 Mcculloch Cir
- 3269 Begonia Cir