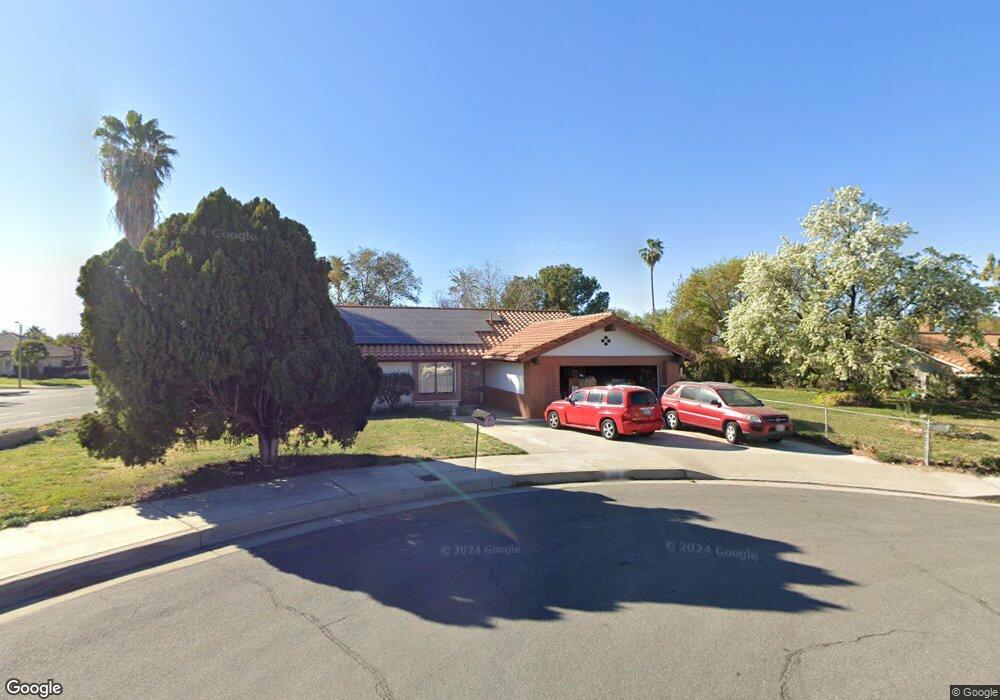
328 Brian Ct Redlands, CA 92374
South Redlands NeighborhoodEstimated Value: $616,929 - $713,000
4
Beds
2
Baths
1,738
Sq Ft
$386/Sq Ft
Est. Value
About This Home
This home is located at 328 Brian Ct, Redlands, CA 92374 and is currently estimated at $670,732, approximately $385 per square foot. 328 Brian Ct is a home located in San Bernardino County with nearby schools including Crafton Elementary School, Moore Middle School, and Redlands East Valley High School.
Ownership History
Date
Name
Owned For
Owner Type
Purchase Details
Closed on
Apr 14, 2023
Sold by
Zahm Virginia E
Bought by
Zahm Living Trust
Current Estimated Value
Purchase Details
Closed on
May 2, 2022
Sold by
Roy A Lewis And Blanche A Lewis Family T
Bought by
Zahm Virginia E
Purchase Details
Closed on
May 28, 1999
Sold by
Salas Claudia J
Bought by
Sales Rufus C
Purchase Details
Closed on
Apr 23, 1999
Sold by
Sales Bire and Sales Rufus C
Bought by
Lewis Roy A and Lewis Blanche A
Create a Home Valuation Report for This Property
The Home Valuation Report is an in-depth analysis detailing your home's value as well as a comparison with similar homes in the area
Home Values in the Area
Average Home Value in this Area
Purchase History
| Date | Buyer | Sale Price | Title Company |
|---|---|---|---|
| Zahm Living Trust | -- | None Listed On Document | |
| Zahm Virginia E | -- | Albrektson & Shumate Llp | |
| Sales Rufus C | -- | Fidelity National Title | |
| Lewis Roy A | $155,500 | Fidelity National Title |
Source: Public Records
Tax History
| Year | Tax Paid | Tax Assessment Tax Assessment Total Assessment is a certain percentage of the fair market value that is determined by local assessors to be the total taxable value of land and additions on the property. | Land | Improvement |
|---|---|---|---|---|
| 2025 | $2,987 | $245,350 | $61,338 | $184,012 |
| 2024 | $2,789 | $240,539 | $60,135 | $180,404 |
| 2023 | $2,784 | $235,823 | $58,956 | $176,867 |
| 2022 | $2,742 | $231,198 | $57,801 | $173,397 |
| 2021 | $2,791 | $226,665 | $56,668 | $169,997 |
| 2020 | $2,748 | $224,341 | $56,087 | $168,254 |
| 2019 | $2,670 | $219,942 | $54,987 | $164,955 |
| 2018 | $2,603 | $215,630 | $53,909 | $161,721 |
| 2017 | $2,579 | $211,402 | $52,852 | $158,550 |
| 2016 | $2,549 | $207,257 | $51,816 | $155,441 |
| 2015 | $2,529 | $204,144 | $51,038 | $153,106 |
| 2014 | $2,482 | $200,145 | $50,038 | $150,107 |
Source: Public Records
Map
Nearby Homes
- 212 Eastpark Ln
- 1665 Wabash Ave
- 0 Wabash Ave Unit IV26041427
- 61 Sparrow Ct
- 1550 Marion Rd
- 56 Dearborn Cir
- 1476 Moore St
- 1592 Christopher Ln
- 1479 Moore St
- 1458 Moore St
- 1452 Moore St
- 1410 Pleasantview Dr
- 1442 Moore St
- 1575 Christopher Ln
- 1580 Lisa Ln
- 1200 E Highland Ave Unit 207
- 1528 Laramie Ave
- 15 Naomi St
- 626 N Dearborn St Unit 150
- 626 N Dearborn St Unit 7
- 325 S La Salle St
- 324 Brian Ct
- 321 S La Salle St
- 331 Brian Ct
- 320 Brian Ct
- 411 S La Salle St
- 317 S La Salle St
- 326 S La Salle St
- 326 Brigette Ct
- 323 Brian Ct
- 322 S La Salle St
- 322 Brigette Ct
- 318 S La Salle St
- 316 Brian Ct
- 431 S La Salle St
- 313 S La Salle St
- 1717 Brittany Dr
- 318 Brigette Ct
- 402 S La Salle St
- 1714 Shirley Ln
Your Personal Tour Guide
Ask me questions while you tour the home.