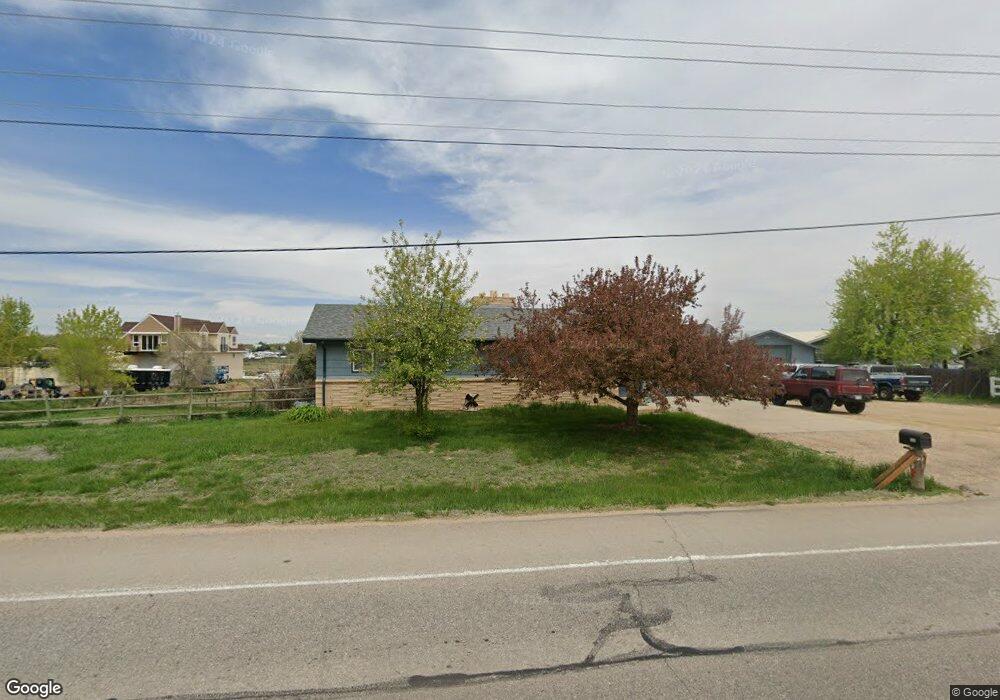
328 E Trilby Rd Fort Collins, CO 80525
Estimated Value: $452,000 - $595,000
4
Beds
2
Baths
2,464
Sq Ft
$212/Sq Ft
Est. Value
About This Home
This home is located at 328 E Trilby Rd, Fort Collins, CO 80525 and is currently estimated at $521,198, approximately $211 per square foot. 328 E Trilby Rd is a home located in Larimer County with nearby schools including Werner Elementary School, Preston Middle School, and Fossil Ridge High School.
Ownership History
Date
Name
Owned For
Owner Type
Purchase Details
Closed on
Oct 29, 2001
Sold by
Chavez Guadalupe and Chavez Maria
Bought by
Chavez Genaro
Current Estimated Value
Home Financials for this Owner
Home Financials are based on the most recent Mortgage that was taken out on this home.
Original Mortgage
$150,500
Outstanding Balance
$59,039
Interest Rate
6.77%
Estimated Equity
$462,159
Purchase Details
Closed on
Nov 30, 2000
Sold by
Bottoms Samuel D Amy M
Bought by
Chavez Guadalupe and Chavez Maria
Home Financials for this Owner
Home Financials are based on the most recent Mortgage that was taken out on this home.
Original Mortgage
$166,000
Interest Rate
7.72%
Purchase Details
Closed on
Jun 22, 1998
Sold by
Rhoads Betty J and Keil Edward
Bought by
Bottoms Samuel D and Bottoms Amy M
Home Financials for this Owner
Home Financials are based on the most recent Mortgage that was taken out on this home.
Original Mortgage
$148,400
Interest Rate
7.21%
Create a Home Valuation Report for This Property
The Home Valuation Report is an in-depth analysis detailing your home's value as well as a comparison with similar homes in the area
Home Values in the Area
Average Home Value in this Area
Purchase History
| Date | Buyer | Sale Price | Title Company |
|---|---|---|---|
| Chavez Genaro | -- | Land Title Guarantee Company | |
| Chavez Guadalupe | $261,500 | -- | |
| Bottoms Samuel D | $164,900 | Land Title |
Source: Public Records
Mortgage History
| Date | Status | Borrower | Loan Amount |
|---|---|---|---|
| Open | Chavez Genaro | $150,500 | |
| Closed | Chavez Guadalupe | $166,000 | |
| Previous Owner | Bottoms Samuel D | $148,400 |
Source: Public Records
Tax History Compared to Growth
Tax History
| Year | Tax Paid | Tax Assessment Tax Assessment Total Assessment is a certain percentage of the fair market value that is determined by local assessors to be the total taxable value of land and additions on the property. | Land | Improvement |
|---|---|---|---|---|
| 2025 | $3,204 | $36,475 | $3,417 | $33,058 |
| 2024 | $3,053 | $36,475 | $3,417 | $33,058 |
| 2022 | $2,297 | $23,825 | $3,545 | $20,280 |
| 2021 | $2,323 | $24,511 | $3,647 | $20,864 |
| 2020 | $1,961 | $20,521 | $3,647 | $16,874 |
| 2019 | $1,969 | $20,521 | $3,647 | $16,874 |
| 2018 | $1,432 | $15,379 | $3,672 | $11,707 |
| 2017 | $1,428 | $15,379 | $3,672 | $11,707 |
| 2016 | $1,909 | $20,458 | $4,060 | $16,398 |
| 2015 | $1,895 | $20,460 | $4,060 | $16,400 |
| 2014 | $1,437 | $15,420 | $3,500 | $11,920 |
Source: Public Records
Map
Nearby Homes
- 6600 Debra Dr
- 708 Crown Ridge Ln
- 365 Stoney Brook Rd
- 6603 Autumn Ridge Dr Unit 2
- 6827 Autumn Ridge Dr Unit 1
- 301 Uranus St
- 5942 Colby St
- 505 Coyote Trail Dr
- 402 Hudson Ct
- 6230 Buchanan St
- 5925 Auburn Dr
- 120 Triangle Dr
- 715 Yarnell Ct
- 320 Strasburg Dr Unit B10
- 501 Yuma Ct
- 306 Saturn Dr
- 900 Somerly Ln
- 7008 Woodrow Dr
- 408 Strasburg Dr Unit B8
- 7151 Shadow Ridge Dr
- 400 E Trilby Rd
- 316 E Trilby Rd
- 412 E Trilby Rd
- 308 E Trilby Rd
- 220 Gary Dr
- 6608 Kevin Dr
- 6524 Lynn Dr
- 300 E Trilby Rd
- 420 E Trilby Rd
- 417 Vivian St
- 6528 Lynn Dr
- 216 Gary Dr
- 433 Vivian St
- 437 Vivian St
- 500 E Trilby Rd
- 324 Vivian St
- 517 E Trilby Rd Unit 33
- 517 E Trilby Rd Unit 34
- 517 E Trilby Rd Unit 7
- 517 E Trilby Rd Unit 20