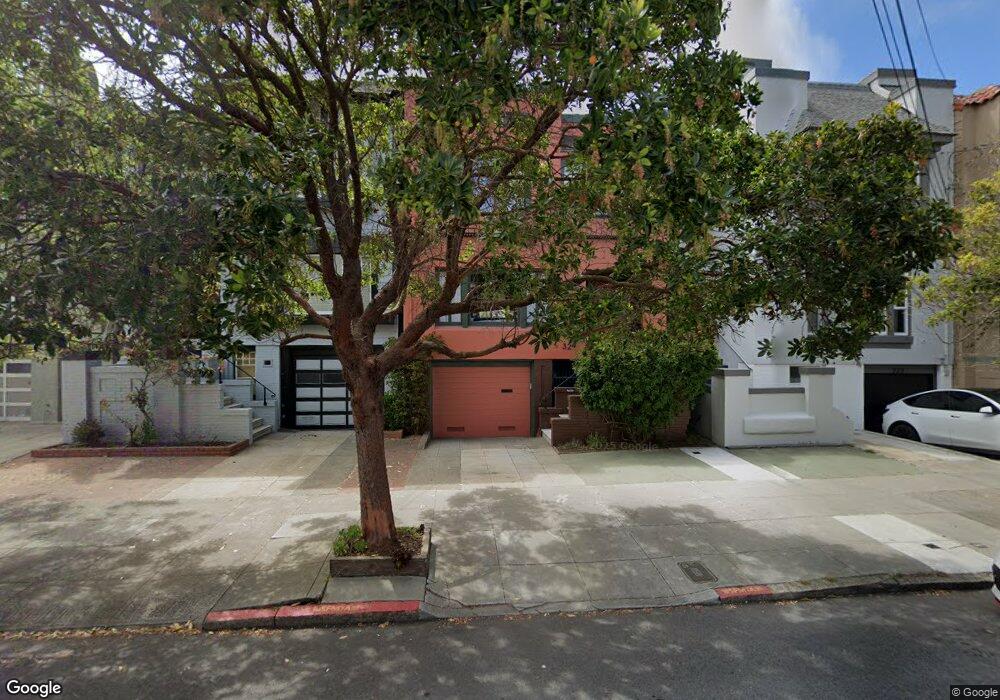
329 16th Ave San Francisco, CA 94118
Central Richmond NeighborhoodEstimated Value: $2,043,000 - $2,582,161
3
Beds
2
Baths
2,682
Sq Ft
$852/Sq Ft
Est. Value
About This Home
This home is located at 329 16th Ave, San Francisco, CA 94118 and is currently estimated at $2,285,290, approximately $852 per square foot. 329 16th Ave is a home located in San Francisco County with nearby schools including Alamo Elementary School, Presidio Middle School, and Stratford School - San Francisco 14th Avenue.
Ownership History
Date
Name
Owned For
Owner Type
Purchase Details
Closed on
Jun 17, 2004
Sold by
Humphreys David W
Bought by
Humphreys David W and Humphreys Michelle C
Current Estimated Value
Home Financials for this Owner
Home Financials are based on the most recent Mortgage that was taken out on this home.
Original Mortgage
$250,000
Interest Rate
6.24%
Mortgage Type
New Conventional
Purchase Details
Closed on
Jun 2, 1999
Sold by
Cooper Michelle Suzanne
Bought by
Humphreys David W
Home Financials for this Owner
Home Financials are based on the most recent Mortgage that was taken out on this home.
Original Mortgage
$501,600
Outstanding Balance
$99,405
Interest Rate
3.95%
Estimated Equity
$2,185,885
Purchase Details
Closed on
May 28, 1999
Sold by
Wrin Harry J
Bought by
Humphreys David W
Home Financials for this Owner
Home Financials are based on the most recent Mortgage that was taken out on this home.
Original Mortgage
$501,600
Outstanding Balance
$99,405
Interest Rate
3.95%
Estimated Equity
$2,185,885
Create a Home Valuation Report for This Property
The Home Valuation Report is an in-depth analysis detailing your home's value as well as a comparison with similar homes in the area
Home Values in the Area
Average Home Value in this Area
Purchase History
| Date | Buyer | Sale Price | Title Company |
|---|---|---|---|
| Humphreys David W | -- | -- | |
| Humphreys David W | -- | Fidelity National Title Co | |
| Humphreys David W | $627,000 | Fidelity National Title Co |
Source: Public Records
Mortgage History
| Date | Status | Borrower | Loan Amount |
|---|---|---|---|
| Closed | Humphreys David W | $250,000 | |
| Open | Humphreys David W | $501,600 |
Source: Public Records
Tax History Compared to Growth
Tax History
| Year | Tax Paid | Tax Assessment Tax Assessment Total Assessment is a certain percentage of the fair market value that is determined by local assessors to be the total taxable value of land and additions on the property. | Land | Improvement |
|---|---|---|---|---|
| 2025 | $13,807 | $1,133,479 | $627,080 | $506,399 |
| 2024 | $13,807 | $1,111,256 | $614,785 | $496,471 |
| 2023 | $13,597 | $1,089,469 | $602,731 | $486,738 |
| 2022 | $13,333 | $1,068,108 | $590,913 | $477,195 |
| 2021 | $13,096 | $1,047,166 | $579,327 | $467,839 |
| 2020 | $13,211 | $1,036,429 | $573,387 | $463,042 |
| 2019 | $12,712 | $1,016,108 | $562,145 | $453,963 |
| 2018 | $12,284 | $996,185 | $551,123 | $445,062 |
| 2017 | $11,841 | $976,653 | $540,317 | $436,336 |
| 2016 | $11,643 | $957,504 | $529,723 | $427,781 |
| 2015 | $11,499 | $943,123 | $521,767 | $421,356 |
| 2014 | $11,196 | $924,650 | $511,547 | $413,103 |
Source: Public Records
Map
Nearby Homes
- 1533 Clement St
- 369 18th Ave Unit 203
- 428 15th Ave
- 1827 Clement St
- 172 18th Ave
- 118 15th Ave
- 118-120 15th Ave
- 154 Funston Ave
- 1324 Lake St
- 459 11th Ave
- 1608 Balboa St
- 1 18th Ave
- 4829 California St
- 1545-1547 Balboa St
- 607 15th Ave
- 519 22nd Ave
- 171 9th Ave Unit 173
- 1532 Cabrillo St
- 1633 Cabrillo St
- 4328 Geary Blvd