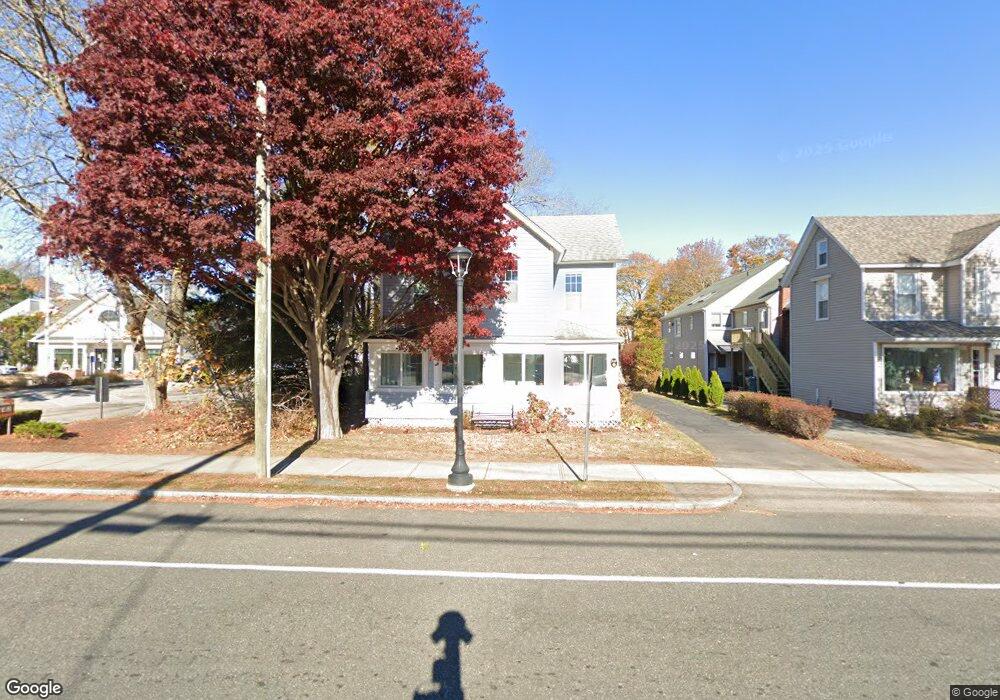
329 Main St Niantic, CT 06357
Niantic NeighborhoodEstimated Value: $380,424 - $579,000
3
Beds
1
Bath
1,741
Sq Ft
$283/Sq Ft
Est. Value
About This Home
This home is located at 329 Main St, Niantic, CT 06357 and is currently estimated at $492,356, approximately $282 per square foot. 329 Main St is a home located in New London County with nearby schools including East Lyme Middle School, East Lyme High School, and The Light House Voc-Ed Center.
Ownership History
Date
Name
Owned For
Owner Type
Purchase Details
Closed on
Aug 24, 2009
Sold by
Fredericks Marcia
Bought by
Fatka Mary Susan and Fatka Paul
Current Estimated Value
Home Financials for this Owner
Home Financials are based on the most recent Mortgage that was taken out on this home.
Original Mortgage
$181,300
Outstanding Balance
$119,945
Interest Rate
5.5%
Mortgage Type
Purchase Money Mortgage
Estimated Equity
$372,411
Create a Home Valuation Report for This Property
The Home Valuation Report is an in-depth analysis detailing your home's value as well as a comparison with similar homes in the area
Home Values in the Area
Average Home Value in this Area
Purchase History
| Date | Buyer | Sale Price | Title Company |
|---|---|---|---|
| Fatka Mary Susan | $226,684 | -- | |
| Fatka Mary Susan | $226,684 | -- |
Source: Public Records
Mortgage History
| Date | Status | Borrower | Loan Amount |
|---|---|---|---|
| Open | Fatka Mary Susan | $181,300 | |
| Closed | Fatka Mary Susan | $181,300 | |
| Previous Owner | Fatka Mary Susan | $155,000 |
Source: Public Records
Tax History
| Year | Tax Paid | Tax Assessment Tax Assessment Total Assessment is a certain percentage of the fair market value that is determined by local assessors to be the total taxable value of land and additions on the property. | Land | Improvement |
|---|---|---|---|---|
| 2025 | $4,231 | $151,060 | $51,870 | $99,190 |
| 2024 | $3,980 | $151,060 | $51,870 | $99,190 |
| 2023 | $3,758 | $151,060 | $51,870 | $99,190 |
| 2022 | $3,601 | $151,060 | $51,870 | $99,190 |
| 2021 | $3,730 | $130,830 | $59,850 | $70,980 |
| 2020 | $3,710 | $130,830 | $59,850 | $70,980 |
| 2019 | $3,688 | $130,830 | $59,850 | $70,980 |
| 2018 | $3,578 | $130,830 | $59,850 | $70,980 |
| 2017 | $3,423 | $130,830 | $59,850 | $70,980 |
| 2016 | $3,025 | $119,280 | $51,870 | $67,410 |
| 2015 | $2,947 | $119,280 | $51,870 | $67,410 |
| 2014 | $2,866 | $119,280 | $51,870 | $67,410 |
Source: Public Records
Map
Nearby Homes
- 185 Main St Unit 301
- 185 Main St Unit 305
- 468 Main St Unit 318
- 468 Main St Unit 111
- 11 Smith Ave
- 47 Village Crossing Unit 47
- 46 Village Crossing Unit 46
- 42 S Washington Ave
- 47 Oswegatchie Hills Rd
- 23 Central Ave
- 127 Black Point Rd Unit 7
- 37 Stoneywood Dr
- 97 W Main St Unit 36
- 20 North Rd
- 36 Attawan Rd
- 26 Mohawk Dr
- 3 E Wood St
- 52B Millstone Rd W
- 86 Corey Ln
- 19 Sapia Dr
- 325 Main St
- 8 Methodist St
- 345 Main St
- 49 Hope St Unit 51
- 41 Hope St
- 395 Main St
- 45 Hope St Unit 7
- 45 Hope St Unit 1
- 45 Hope St Unit 4
- 45 Hope St Unit 5
- 45 Hope St Unit 8
- 45 Hope St Unit 9
- 45 Hope St Unit 3
- 45 Hope St Unit 6
- 45 Hope St Unit 2
- 5 Methodist St Unit 3
- 5 Methodist St Unit 6
- 5 Methodist St Unit 2
- 49 Hope St
- 326 Main St
Your Personal Tour Guide
Ask me questions while you tour the home.