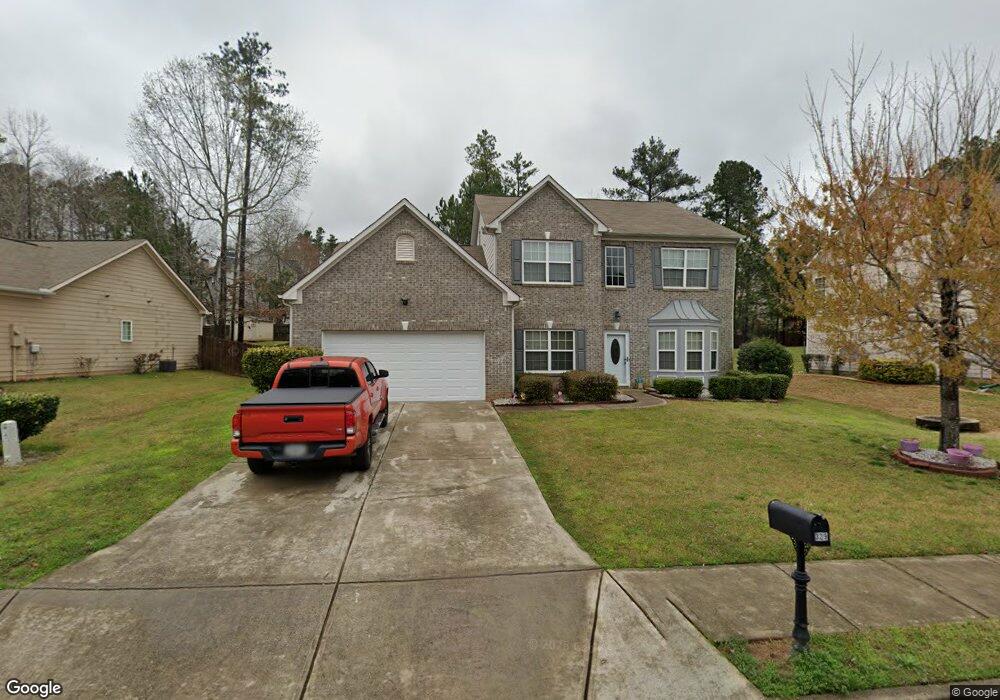
329 Viceroy Curve Stockbridge, GA 30281
Estimated Value: $333,166 - $372,000
4
Beds
3
Baths
2,805
Sq Ft
$126/Sq Ft
Est. Value
About This Home
This home is located at 329 Viceroy Curve, Stockbridge, GA 30281 and is currently estimated at $353,792, approximately $126 per square foot. 329 Viceroy Curve is a home located in Henry County with nearby schools including Red Oak Elementary School, Dutchtown Middle School, and Dutchtown High School.
Ownership History
Date
Name
Owned For
Owner Type
Purchase Details
Closed on
Aug 27, 2010
Sold by
Terry Barbara
Bought by
Ross Jackie F
Current Estimated Value
Home Financials for this Owner
Home Financials are based on the most recent Mortgage that was taken out on this home.
Original Mortgage
$125,312
Outstanding Balance
$84,215
Interest Rate
4.87%
Mortgage Type
FHA
Estimated Equity
$269,577
Purchase Details
Closed on
Apr 20, 2007
Sold by
Jpmorgan Chase Bk
Bought by
Terry Barbara
Home Financials for this Owner
Home Financials are based on the most recent Mortgage that was taken out on this home.
Original Mortgage
$194,900
Interest Rate
6.1%
Mortgage Type
New Conventional
Purchase Details
Closed on
Aug 1, 2006
Sold by
Norfleet George
Bought by
Jp Morgan Chase Bk
Purchase Details
Closed on
Apr 25, 2005
Sold by
Ryland Grp Inc
Bought by
Norfleet George
Home Financials for this Owner
Home Financials are based on the most recent Mortgage that was taken out on this home.
Original Mortgage
$203,414
Interest Rate
9.5%
Mortgage Type
New Conventional
Purchase Details
Closed on
Dec 22, 2004
Sold by
Pathway Henry I
Bought by
Grp Ryland
Create a Home Valuation Report for This Property
The Home Valuation Report is an in-depth analysis detailing your home's value as well as a comparison with similar homes in the area
Home Values in the Area
Average Home Value in this Area
Purchase History
| Date | Buyer | Sale Price | Title Company |
|---|---|---|---|
| Ross Jackie F | $127,000 | -- | |
| Terry Barbara | $194,900 | -- | |
| Jp Morgan Chase Bk | $214,699 | -- | |
| Norfleet George | $214,200 | -- | |
| Grp Ryland | $43,000 | -- |
Source: Public Records
Mortgage History
| Date | Status | Borrower | Loan Amount |
|---|---|---|---|
| Open | Ross Jackie F | $125,312 | |
| Previous Owner | Terry Barbara | $194,900 | |
| Previous Owner | Norfleet George | $203,414 |
Source: Public Records
Tax History Compared to Growth
Tax History
| Year | Tax Paid | Tax Assessment Tax Assessment Total Assessment is a certain percentage of the fair market value that is determined by local assessors to be the total taxable value of land and additions on the property. | Land | Improvement |
|---|---|---|---|---|
| 2025 | $2,170 | $133,800 | $18,000 | $115,800 |
| 2024 | $2,170 | $128,600 | $18,000 | $110,600 |
| 2023 | $1,873 | $133,160 | $14,000 | $119,160 |
| 2022 | $4,716 | $116,720 | $14,000 | $102,720 |
| 2021 | $3,709 | $90,280 | $12,000 | $78,280 |
| 2020 | $3,388 | $81,840 | $10,000 | $71,840 |
| 2019 | $3,040 | $74,600 | $10,000 | $64,600 |
| 2018 | $3,010 | $73,800 | $10,000 | $63,800 |
| 2016 | $2,559 | $62,040 | $9,600 | $52,440 |
| 2015 | $2,528 | $59,400 | $7,200 | $52,200 |
| 2014 | $2,302 | $53,040 | $7,200 | $45,840 |
Source: Public Records
Map
Nearby Homes
- 591 Creek Valley Ct
- 687 Pathwood Ln
- 3916 Champagne Dr
- 266 Monarch Village Way
- 520 Monarch Lake Way
- 300 Monarch Village Way
- 602 Brookwater Dr
- 623 Brookwater Dr
- 540 Anglewood Trace
- 719 Nightwind Way
- 4025 Jamaica Dr
- 512 Chaucer Way Unit 1
- 213 Sunderland Way Unit 1
- 9055 Kelly Ct
- 125 Oak Leaf Dr
- 1341 Kent Manor Unit 3
- 1653 Jersey Dr
- 198 Broder Farms Dr
- 1545 Brangus Dr
- 331 Viceroy Curve
- 411 Azure Ct
- 325 Viceroy Curve
- 409 Azure Ct
- 333 Viceroy Curve
- 407 Azure Ct
- 336 Viceroy Curve
- 413 Azure Ct
- 338 Viceroy Curve
- 334 Viceroy Curve
- 323 Viceroy Curve
- 405 Azure Ct
- 332 Viceroy Curve
- 586 Creek Valley Ct
- 590 Creek Valley Ct
- 584 Creek Valley Ct
- 415 Azure Ct
- 330 Viceroy Curve
- 403 Azure Ct
- 321 Viceroy Curve