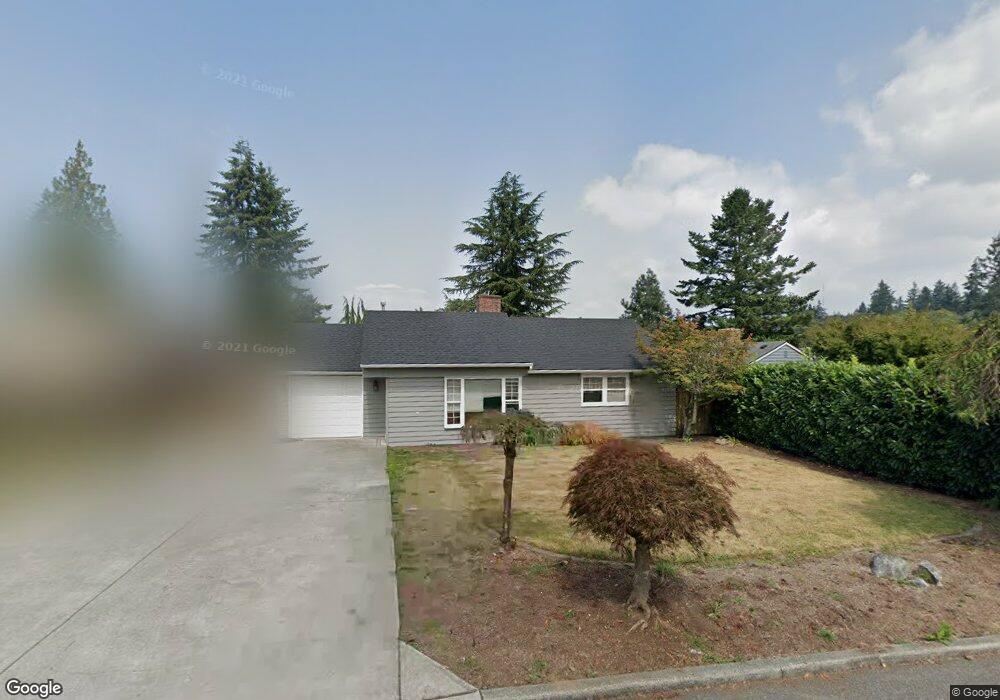
329 View Ridge Dr Everett, WA 98203
View Ridge Madison NeighborhoodEstimated Value: $561,321 - $724,000
3
Beds
2
Baths
1,130
Sq Ft
$537/Sq Ft
Est. Value
About This Home
This home is located at 329 View Ridge Dr, Everett, WA 98203 and is currently estimated at $607,330, approximately $537 per square foot. 329 View Ridge Dr is a home located in Snohomish County with nearby schools including View Ridge Elementary School, Evergreen Middle School, and Everett High School.
Ownership History
Date
Name
Owned For
Owner Type
Purchase Details
Closed on
Oct 23, 2003
Sold by
Anderson Allison and Anderson Allison J
Bought by
Shaffer James Gregory
Current Estimated Value
Home Financials for this Owner
Home Financials are based on the most recent Mortgage that was taken out on this home.
Original Mortgage
$165,600
Outstanding Balance
$72,968
Interest Rate
5.98%
Mortgage Type
Purchase Money Mortgage
Estimated Equity
$534,362
Purchase Details
Closed on
Oct 23, 2002
Sold by
Johnson Andrew J
Bought by
Anderson Allison
Purchase Details
Closed on
Oct 13, 2000
Sold by
Austin Kimberly Kae and Leon Borden B
Bought by
Johnson Andrew D and Anderson Allison
Home Financials for this Owner
Home Financials are based on the most recent Mortgage that was taken out on this home.
Original Mortgage
$161,146
Interest Rate
7.96%
Mortgage Type
FHA
Create a Home Valuation Report for This Property
The Home Valuation Report is an in-depth analysis detailing your home's value as well as a comparison with similar homes in the area
Home Values in the Area
Average Home Value in this Area
Purchase History
| Date | Buyer | Sale Price | Title Company |
|---|---|---|---|
| Shaffer James Gregory | $207,000 | Stewart Title Company | |
| Anderson Allison | -- | -- | |
| Johnson Andrew D | $162,500 | First American Title |
Source: Public Records
Mortgage History
| Date | Status | Borrower | Loan Amount |
|---|---|---|---|
| Open | Shaffer James Gregory | $165,600 | |
| Previous Owner | Johnson Andrew D | $161,146 |
Source: Public Records
Tax History
| Year | Tax Paid | Tax Assessment Tax Assessment Total Assessment is a certain percentage of the fair market value that is determined by local assessors to be the total taxable value of land and additions on the property. | Land | Improvement |
|---|---|---|---|---|
| 2026 | $4,551 | $544,700 | $406,000 | $138,700 |
| 2025 | $4,165 | $522,000 | $390,000 | $132,000 |
| 2024 | $4,165 | $485,000 | $353,000 | $132,000 |
| 2023 | $4,249 | $517,400 | $355,000 | $162,400 |
| 2022 | $3,625 | $395,900 | $262,000 | $133,900 |
| 2020 | $3,681 | $327,900 | $209,000 | $118,900 |
| 2019 | $3,489 | $312,800 | $201,000 | $111,800 |
| 2018 | $3,361 | $276,200 | $172,000 | $104,200 |
| 2017 | $2,905 | $237,800 | $142,000 | $95,800 |
| 2016 | $2,987 | $257,000 | $165,000 | $92,000 |
| 2015 | $2,812 | $227,900 | $151,000 | $76,900 |
| 2013 | $2,595 | $185,600 | $124,000 | $61,600 |
Source: Public Records
Map
Nearby Homes
- 330 Elm St Unit 201
- 411 Crown Dr
- 456 View Ridge Dr
- 1033 W Mukilteo Blvd
- 4525 5th Dr SE
- 4325 Federal Ave
- 1612 Holbrook Ave
- 3420 Snohomish Ave
- 4711 Castle Ln
- 3931 Friday Ave
- 1713 Bailey Ave
- 1719 Bailey Ave
- 5209 Glenwood Ave
- 1621 Edgemoor Ln
- 4404 Terrace Dr Unit 10
- 4404 Terrace Dr Unit 8
- 4404 Terrace Dr Unit 3
- 3615 Friday Ave
- 4013 High St
- 5525 Glenwood Ave
- 337 View Ridge Dr
- 323 View Ridge Dr
- 319 View Ridge Dr
- 343 View Ridge Dr
- 324 Park Place
- 332 View Ridge Dr
- 326 View Ridge Dr
- 326 Park Place
- 336 View Ridge Dr
- 320 Park Place
- 344 View Ridge Dr
- 349 Heather Rd
- 349 View Ridge Dr
- 318 View Ridge Dr
- 328 Park Place
- 345 Heather Rd
- 310 View Ridge Dr
- 403 View Ridge Dr
- 333 Elm St
- 425 45th St SW
Your Personal Tour Guide
Ask me questions while you tour the home.