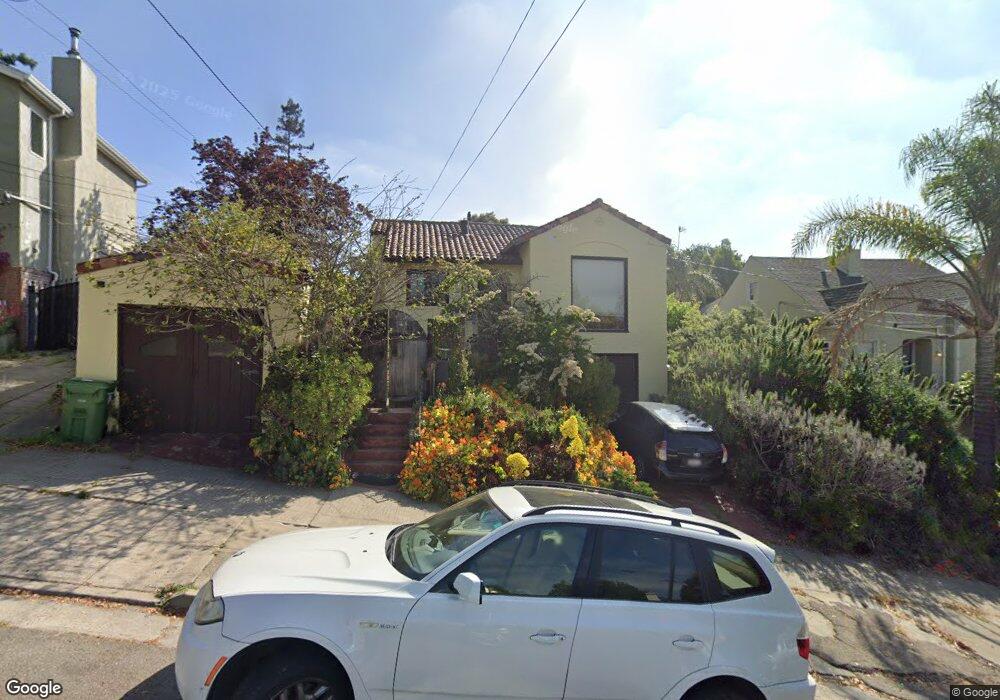
3290 Morcom Ave Oakland, CA 94619
Maxwell Park NeighborhoodEstimated Value: $1,023,000 - $1,281,000
4
Beds
2
Baths
2,486
Sq Ft
$475/Sq Ft
Est. Value
About This Home
This home is located at 3290 Morcom Ave, Oakland, CA 94619 and is currently estimated at $1,180,799, approximately $474 per square foot. 3290 Morcom Ave is a home located in Alameda County with nearby schools including Laurel Elementary School, Frick United Academy of Language, and Skyline High School.
Ownership History
Date
Name
Owned For
Owner Type
Purchase Details
Closed on
Nov 11, 2003
Sold by
Williams Lucinda D and Case #256582
Bought by
Hadley Susan J
Current Estimated Value
Home Financials for this Owner
Home Financials are based on the most recent Mortgage that was taken out on this home.
Original Mortgage
$396,000
Outstanding Balance
$170,751
Interest Rate
5%
Mortgage Type
Purchase Money Mortgage
Estimated Equity
$1,010,048
Create a Home Valuation Report for This Property
The Home Valuation Report is an in-depth analysis detailing your home's value as well as a comparison with similar homes in the area
Home Values in the Area
Average Home Value in this Area
Purchase History
| Date | Buyer | Sale Price | Title Company |
|---|---|---|---|
| Hadley Susan J | $495,000 | Chicago Title Company |
Source: Public Records
Mortgage History
| Date | Status | Borrower | Loan Amount |
|---|---|---|---|
| Open | Hadley Susan J | $396,000 | |
| Closed | Hadley Susan J | $49,500 |
Source: Public Records
Tax History
| Year | Tax Paid | Tax Assessment Tax Assessment Total Assessment is a certain percentage of the fair market value that is determined by local assessors to be the total taxable value of land and additions on the property. | Land | Improvement |
|---|---|---|---|---|
| 2025 | $11,055 | $696,745 | $211,123 | $492,622 |
| 2024 | $11,055 | $682,950 | $206,985 | $482,965 |
| 2023 | $11,558 | $676,421 | $202,926 | $473,495 |
| 2022 | $11,182 | $656,160 | $198,948 | $464,212 |
| 2021 | $10,637 | $643,161 | $195,048 | $455,113 |
| 2020 | $10,517 | $643,500 | $193,050 | $450,450 |
| 2019 | $10,086 | $630,881 | $189,264 | $441,617 |
| 2018 | $9,871 | $618,511 | $185,553 | $432,958 |
| 2017 | $9,476 | $606,384 | $181,915 | $424,469 |
| 2016 | $9,178 | $594,494 | $178,348 | $416,146 |
| 2015 | $9,127 | $585,564 | $175,669 | $409,895 |
| 2014 | $9,381 | $574,095 | $172,228 | $401,867 |
Source: Public Records
Map
Nearby Homes
- 5091 Macarthur Blvd
- 5146 Camden St
- 4737 Redding St
- 25 Redding Place
- 3118 Monticello Ave
- 3734 Mcclelland St
- 3121 Monticello Ave
- 5407 Roberts Ave
- 4535 Redding St
- 3000 56th Ave
- 4475 Redding St
- 2832 Monticello Ave
- 4471 Tulip Ave
- 4484 Tulip Ave
- 5230 Hillen Dr
- 4830 Fair Ave
- 5721 Roberts Ave
- 2745 Maxwell Ave
- 0 Outlook Ave
- 5922 Camden St
- 3280 Morcom Ave Unit A
- 3280 Morcom Ave Unit B
- 3280 Morcom Ave
- 3280 Morcom Ave Unit A
- 3280 Morcom Ave Unit B
- 3280 Morcom Ave
- 3294 Morcom Ave
- 3274 Morcom Ave
- 3471 Wyman St
- 3629 Wyman St
- 3401 Wyman St
- 3264 Morcom Ave
- 3395 Wyman St
- 3409 Wyman St
- 3421 Wyman St
- 3287 Morcom Ave
- 3275 Morcom Ave
- 3381 Wyman St
- 3291 Morcom Ave
- 3258 Morcom Ave
Your Personal Tour Guide
Ask me questions while you tour the home.