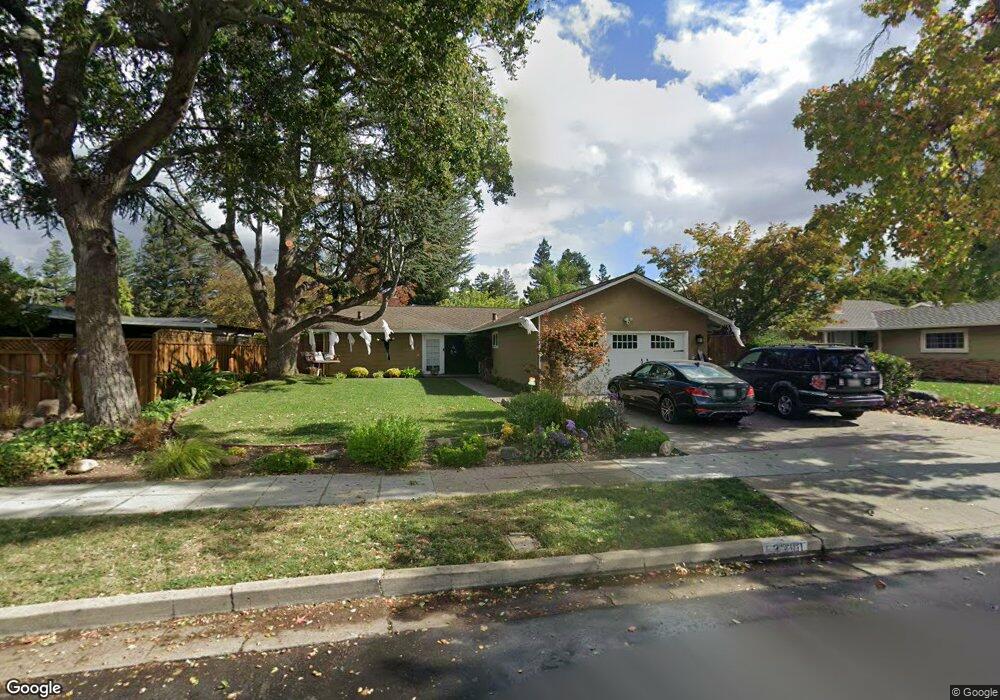
3290 Todd Way San Jose, CA 95124
Cambrian NeighborhoodEstimated Value: $1,360,000 - $1,872,000
3
Beds
2
Baths
1,260
Sq Ft
$1,321/Sq Ft
Est. Value
About This Home
This home is located at 3290 Todd Way, San Jose, CA 95124 and is currently estimated at $1,663,985, approximately $1,320 per square foot. 3290 Todd Way is a home located in Santa Clara County with nearby schools including Branham High School, Fammatre Elementary School, and Sartorette Charter School.
Ownership History
Date
Name
Owned For
Owner Type
Purchase Details
Closed on
Sep 23, 2015
Sold by
Newton Dwight and Newton Patricia
Bought by
Newton Revocable Trust and Newton Patricia
Current Estimated Value
Purchase Details
Closed on
Sep 10, 2002
Sold by
Hobbs Bryan C and Hobbs Juliet R
Bought by
Newton Dwight E and Newton Patricia A
Home Financials for this Owner
Home Financials are based on the most recent Mortgage that was taken out on this home.
Original Mortgage
$445,550
Outstanding Balance
$186,121
Interest Rate
6.24%
Estimated Equity
$1,477,864
Purchase Details
Closed on
Dec 10, 1996
Sold by
Rippen Rebecca E
Bought by
Hobbs Bryan C and Hobbs Juliet R
Home Financials for this Owner
Home Financials are based on the most recent Mortgage that was taken out on this home.
Original Mortgage
$176,800
Interest Rate
7.62%
Purchase Details
Closed on
Jul 25, 1996
Sold by
Rippen Rebecca E
Bought by
Rippen Rebecca E
Create a Home Valuation Report for This Property
The Home Valuation Report is an in-depth analysis detailing your home's value as well as a comparison with similar homes in the area
Home Values in the Area
Average Home Value in this Area
Purchase History
| Date | Buyer | Sale Price | Title Company |
|---|---|---|---|
| Newton Revocable Trust | -- | None Available | |
| Newton Dwight | -- | None Available | |
| Newton Dwight E | $495,000 | First American Title Company | |
| Hobbs Bryan C | $221,000 | Commonwealth Land Title Co | |
| Rippen Rebecca E | -- | -- | |
| Rippen Rebecca E | -- | -- |
Source: Public Records
Mortgage History
| Date | Status | Borrower | Loan Amount |
|---|---|---|---|
| Open | Newton Dwight E | $445,550 | |
| Previous Owner | Hobbs Bryan C | $176,800 | |
| Closed | Hobbs Bryan C | $22,100 |
Source: Public Records
Tax History Compared to Growth
Tax History
| Year | Tax Paid | Tax Assessment Tax Assessment Total Assessment is a certain percentage of the fair market value that is determined by local assessors to be the total taxable value of land and additions on the property. | Land | Improvement |
|---|---|---|---|---|
| 2025 | $10,113 | $716,903 | $322,534 | $394,369 |
| 2024 | $10,113 | $702,847 | $316,210 | $386,637 |
| 2023 | $10,023 | $689,066 | $310,010 | $379,056 |
| 2022 | $9,847 | $675,556 | $303,932 | $371,624 |
| 2021 | $9,634 | $662,311 | $297,973 | $364,338 |
| 2020 | $9,192 | $655,521 | $294,918 | $360,603 |
| 2019 | $9,068 | $642,669 | $289,136 | $353,533 |
| 2018 | $8,819 | $630,068 | $283,467 | $346,601 |
| 2017 | $8,632 | $617,714 | $277,909 | $339,805 |
| 2016 | $8,222 | $605,603 | $272,460 | $333,143 |
| 2015 | $8,120 | $596,507 | $268,368 | $328,139 |
| 2014 | $7,578 | $584,824 | $263,112 | $321,712 |
Source: Public Records
Map
Nearby Homes
- 3328 Kimber Ct Unit 21
- 3429 New Jersey Ave
- 1921 Camden Ave
- 2925 Newark Way
- 1828 Nestorita Way
- 14361 Lenray Ln
- 1800 Donna Ln
- 1799 Bradford Way
- 3335 Jennifer Way
- 1795 Foxworthy Ave
- 1503 Love Ct
- 3161 Quinto Way
- 14570 Wyrick Ave
- 2917 Quinto Way
- 1505 Love Ct
- 1507 Love Ct
- 1502 Love Ct
- 1501 Paradise Ct
- 1500 Paradise Ct
- 2751 Coit Dr