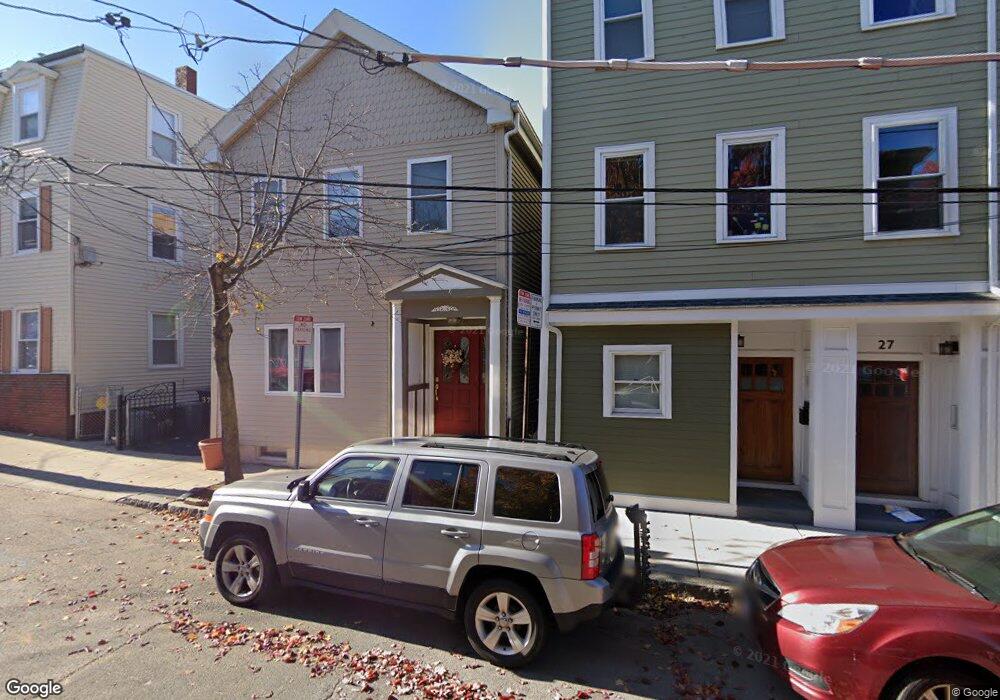
33 5th St Cambridge, MA 02141
East Cambridge NeighborhoodEstimated Value: $1,152,000 - $1,317,688
5
Beds
3
Baths
1,680
Sq Ft
$755/Sq Ft
Est. Value
About This Home
This home is located at 33 5th St, Cambridge, MA 02141 and is currently estimated at $1,269,172, approximately $755 per square foot. 33 5th St is a home located in Middlesex County with nearby schools including Prospect Hill Academy Charter School and Community Charter School of Cambridge.
Ownership History
Date
Name
Owned For
Owner Type
Purchase Details
Closed on
Apr 15, 2022
Sold by
Picanco Anne M
Bought by
Picanco Anne-Marie and Picanco Jose M
Current Estimated Value
Home Financials for this Owner
Home Financials are based on the most recent Mortgage that was taken out on this home.
Original Mortgage
$251,500
Outstanding Balance
$235,220
Interest Rate
3.85%
Mortgage Type
Stand Alone Refi Refinance Of Original Loan
Estimated Equity
$1,033,952
Create a Home Valuation Report for This Property
The Home Valuation Report is an in-depth analysis detailing your home's value as well as a comparison with similar homes in the area
Home Values in the Area
Average Home Value in this Area
Purchase History
| Date | Buyer | Sale Price | Title Company |
|---|---|---|---|
| Picanco Anne-Marie | -- | None Available | |
| Picanco Anne-Marie | -- | None Available |
Source: Public Records
Mortgage History
| Date | Status | Borrower | Loan Amount |
|---|---|---|---|
| Open | Picanco Anne-Marie | $251,500 | |
| Closed | Picanco Anne-Marie | $251,500 |
Source: Public Records
Tax History Compared to Growth
Tax History
| Year | Tax Paid | Tax Assessment Tax Assessment Total Assessment is a certain percentage of the fair market value that is determined by local assessors to be the total taxable value of land and additions on the property. | Land | Improvement |
|---|---|---|---|---|
| 2025 | $6,767 | $1,065,600 | $598,500 | $467,100 |
| 2024 | $6,504 | $1,098,700 | $649,000 | $449,700 |
| 2023 | $5,943 | $1,014,100 | $619,600 | $394,500 |
| 2022 | $5,601 | $982,300 | $625,800 | $356,500 |
| 2021 | $5,601 | $957,400 | $614,100 | $343,300 |
| 2020 | $5,500 | $956,600 | $619,900 | $336,700 |
| 2019 | $5,497 | $925,400 | $608,000 | $317,400 |
| 2018 | $4,963 | $789,000 | $504,200 | $284,800 |
| 2017 | $4,771 | $735,200 | $450,800 | $284,400 |
| 2016 | $4,319 | $617,900 | $353,000 | $264,900 |
| 2015 | $4,207 | $538,000 | $302,500 | $235,500 |
| 2014 | $3,733 | $445,500 | $234,300 | $211,200 |
Source: Public Records
Map
Nearby Homes
- 36 Sciarappa St
- 68 Gore St
- 25 6th St
- 170 Gore St Unit 502
- 170 Gore St Unit 113
- 76-78 Thorndike St
- 59 7th St Unit 2
- 59 7th St Unit 1
- 59 7th St Unit 3
- 30 2nd St Unit 2
- 30 2nd St Unit 1
- 30 2nd St Unit 1 & 2
- 50 Spring St
- 17 Otis St Unit 602
- 9 Medford St Unit 3
- 133 Charles St Unit 133
- 71 Fulkerson St Unit 206
- 95 2nd St Unit 3
- 1 Marion St Unit 1
- 1 Marion St Unit 6,7
- 27 5th St
- 27 5th St Unit 1
- 27 5th St Unit 6
- 27 5th St Unit 4
- 27 5th St Unit 5
- 33 5th St Unit 1
- 33 5th St Unit 1,33.5
- 120 Gore St
- 36 5th St Unit 2
- 37 5th St
- 25 5th St Unit 25.5
- 112 Gore St Unit 2
- 112 Gore St Unit 1
- 112 Gore St Unit 3
- 110 Gore St
- 122 Gore St Unit 2
- 122 Gore St
- 41 5th St Unit 2
- 43 5th St Unit 1
- 43 5th St