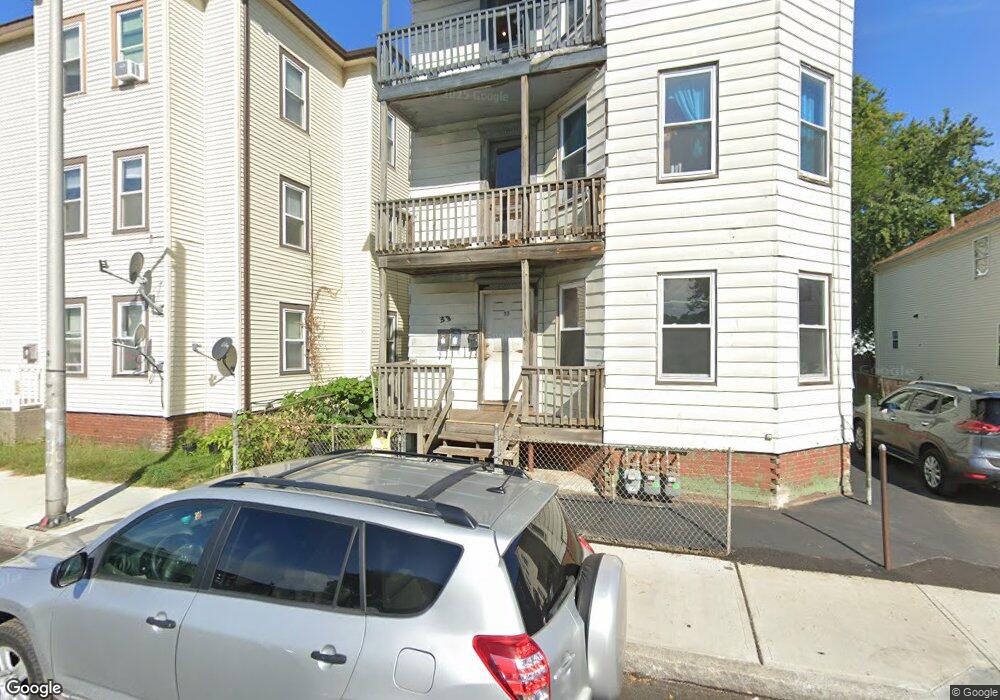
33 Colton St Worcester, MA 01610
South Worcester NeighborhoodEstimated Value: $594,000 - $768,000
9
Beds
3
Baths
3,582
Sq Ft
$186/Sq Ft
Est. Value
About This Home
This home is located at 33 Colton St, Worcester, MA 01610 and is currently estimated at $664,667, approximately $185 per square foot. 33 Colton St is a home located in Worcester County with nearby schools including Jacob Hiatt Magnet School, Chandler Elementary Community School, and Chandler Magnet.
Ownership History
Date
Name
Owned For
Owner Type
Purchase Details
Closed on
Apr 22, 2022
Sold by
Chansignavong Sophit and Chansignavong Sing
Bought by
Chansignavong Matthew
Current Estimated Value
Home Financials for this Owner
Home Financials are based on the most recent Mortgage that was taken out on this home.
Original Mortgage
$130,125
Outstanding Balance
$121,262
Interest Rate
3.85%
Mortgage Type
Purchase Money Mortgage
Estimated Equity
$543,405
Purchase Details
Closed on
Sep 11, 1998
Sold by
Pnc Mtg Corp America
Bought by
Chansignavong Sophit and Chansignavong Sing
Home Financials for this Owner
Home Financials are based on the most recent Mortgage that was taken out on this home.
Original Mortgage
$54,000
Interest Rate
6.92%
Mortgage Type
Purchase Money Mortgage
Purchase Details
Closed on
Jul 30, 1998
Sold by
Uprajay Sounthone and Fnma
Bought by
Pnc Mtg Corp America
Home Financials for this Owner
Home Financials are based on the most recent Mortgage that was taken out on this home.
Original Mortgage
$54,000
Interest Rate
6.92%
Mortgage Type
Purchase Money Mortgage
Create a Home Valuation Report for This Property
The Home Valuation Report is an in-depth analysis detailing your home's value as well as a comparison with similar homes in the area
Home Values in the Area
Average Home Value in this Area
Purchase History
| Date | Buyer | Sale Price | Title Company |
|---|---|---|---|
| Chansignavong Matthew | $173,500 | None Available | |
| Chansignavong Sophit | $60,000 | -- | |
| Pnc Mtg Corp America | $62,700 | -- |
Source: Public Records
Mortgage History
| Date | Status | Borrower | Loan Amount |
|---|---|---|---|
| Open | Chansignavong Matthew | $130,125 | |
| Previous Owner | Pnc Mtg Corp America | $129,000 | |
| Previous Owner | Pnc Mtg Corp America | $54,000 |
Source: Public Records
Tax History Compared to Growth
Tax History
| Year | Tax Paid | Tax Assessment Tax Assessment Total Assessment is a certain percentage of the fair market value that is determined by local assessors to be the total taxable value of land and additions on the property. | Land | Improvement |
|---|---|---|---|---|
| 2025 | $5,623 | $426,300 | $50,700 | $375,600 |
| 2024 | $5,160 | $375,300 | $50,700 | $324,600 |
| 2023 | $4,894 | $341,300 | $40,100 | $301,200 |
| 2022 | $4,260 | $280,100 | $32,100 | $248,000 |
| 2021 | $4,171 | $256,200 | $25,700 | $230,500 |
| 2020 | $3,669 | $215,800 | $25,700 | $190,100 |
| 2019 | $3,710 | $206,100 | $24,500 | $181,600 |
| 2018 | $3,608 | $190,800 | $24,500 | $166,300 |
| 2017 | $3,365 | $175,100 | $24,500 | $150,600 |
| 2016 | $2,547 | $123,600 | $17,300 | $106,300 |
| 2015 | $2,481 | $123,600 | $17,300 | $106,300 |
| 2014 | $2,415 | $123,600 | $17,300 | $106,300 |
Source: Public Records
Map
Nearby Homes
- 20 Washburn St
- 607 Cambridge St Unit 4
- 73 Southgate St
- 33 Sigel St Unit B
- 10 Douglas Ct
- 14 Douglas Ct
- 120 Grand St
- 13 Sigel St
- 195 Millbury St
- 31 Camp St
- 69 Oread St
- 7 Lodi St
- 5 Ripley Place
- 340 Harding St
- 21 Illinois St Unit 508
- 10 Ellsworth St
- 26 Maxwell St
- 5 Mount Pleasant St
- 12 Hillside St
- 1 Hathaway St