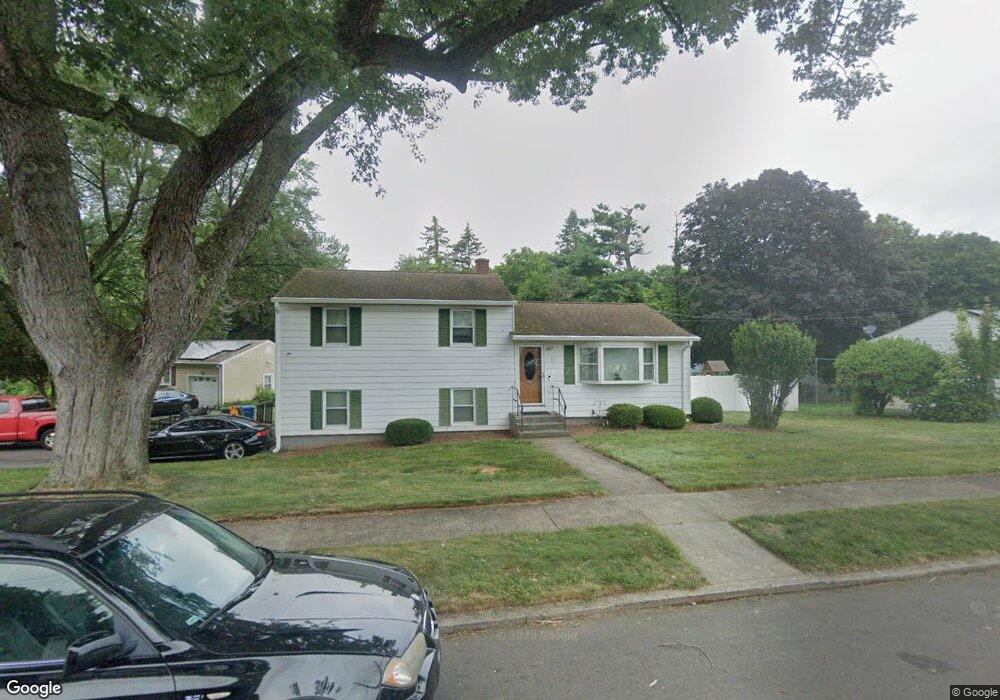
33 Dennis Cir Hamden, CT 06514
Estimated Value: $367,946 - $407,000
3
Beds
2
Baths
1,668
Sq Ft
$229/Sq Ft
Est. Value
About This Home
This home is located at 33 Dennis Cir, Hamden, CT 06514 and is currently estimated at $381,737, approximately $228 per square foot. 33 Dennis Cir is a home located in New Haven County with nearby schools including Hamden Middle School, Hamden High School, and Salma K. Farid Academy.
Ownership History
Date
Name
Owned For
Owner Type
Purchase Details
Closed on
Feb 29, 1996
Sold by
Romanoff Marilyn Est
Bought by
Rapuano Michael and Edwards Anna D
Current Estimated Value
Home Financials for this Owner
Home Financials are based on the most recent Mortgage that was taken out on this home.
Original Mortgage
$90,250
Interest Rate
7.02%
Mortgage Type
Purchase Money Mortgage
Create a Home Valuation Report for This Property
The Home Valuation Report is an in-depth analysis detailing your home's value as well as a comparison with similar homes in the area
Home Values in the Area
Average Home Value in this Area
Purchase History
| Date | Buyer | Sale Price | Title Company |
|---|---|---|---|
| Rapuano Michael | $95,000 | -- |
Source: Public Records
Mortgage History
| Date | Status | Borrower | Loan Amount |
|---|---|---|---|
| Open | Rapuano Michael | $35,000 | |
| Closed | Rapuano Michael | $90,900 | |
| Closed | Rapuano Michael | $90,250 |
Source: Public Records
Tax History
| Year | Tax Paid | Tax Assessment Tax Assessment Total Assessment is a certain percentage of the fair market value that is determined by local assessors to be the total taxable value of land and additions on the property. | Land | Improvement |
|---|---|---|---|---|
| 2025 | $11,864 | $228,690 | $61,950 | $166,740 |
| 2024 | $7,933 | $142,660 | $34,300 | $108,360 |
| 2023 | $8,043 | $142,660 | $34,300 | $108,360 |
| 2022 | $7,915 | $142,660 | $34,300 | $108,360 |
| 2021 | $7,481 | $142,660 | $34,300 | $108,360 |
| 2020 | $6,335 | $121,870 | $45,710 | $76,160 |
| 2019 | $5,955 | $121,870 | $45,710 | $76,160 |
| 2018 | $5,845 | $121,870 | $45,710 | $76,160 |
| 2017 | $5,516 | $121,870 | $45,710 | $76,160 |
| 2016 | $5,528 | $121,870 | $45,710 | $76,160 |
| 2015 | $5,696 | $139,370 | $57,190 | $82,180 |
| 2014 | $5,565 | $139,370 | $57,190 | $82,180 |
Source: Public Records
Map
Nearby Homes
Your Personal Tour Guide
Ask me questions while you tour the home.