33 Farm Ln Seabrook, NH 03874
Estimated Value: $608,000 - $683,000
4
Beds
3
Baths
2,680
Sq Ft
$241/Sq Ft
Est. Value
About This Home
This home is located at 33 Farm Ln, Seabrook, NH 03874 and is currently estimated at $645,039, approximately $240 per square foot. 33 Farm Ln is a home located in Rockingham County with nearby schools including Seabrook Elementary School, Seabrook Middle School, and Winnacunnet High School.
Ownership History
Date
Name
Owned For
Owner Type
Purchase Details
Closed on
Aug 28, 2024
Sold by
Flanagan Robert P and Inst Svgs Newburyport
Bought by
Gra Re Holdings Llc
Current Estimated Value
Purchase Details
Closed on
Oct 7, 1999
Sold by
North Atlantic Energy
Bought by
Flanagan Robert and Flanagan Ruth
Create a Home Valuation Report for This Property
The Home Valuation Report is an in-depth analysis detailing your home's value as well as a comparison with similar homes in the area
Home Values in the Area
Average Home Value in this Area
Purchase History
| Date | Buyer | Sale Price | Title Company |
|---|---|---|---|
| Gra Re Holdings Llc | $455,000 | None Available | |
| Gra Re Holdings Llc | $455,000 | None Available | |
| Flanagan Robert | $12,000 | -- |
Source: Public Records
Mortgage History
| Date | Status | Borrower | Loan Amount |
|---|---|---|---|
| Previous Owner | Flanagan Robert | $196,000 | |
| Previous Owner | Flanagan Robert | $200,000 |
Source: Public Records
Tax History Compared to Growth
Tax History
| Year | Tax Paid | Tax Assessment Tax Assessment Total Assessment is a certain percentage of the fair market value that is determined by local assessors to be the total taxable value of land and additions on the property. | Land | Improvement |
|---|---|---|---|---|
| 2024 | $7,210 | $615,200 | $283,500 | $331,700 |
| 2023 | $7,799 | $516,800 | $240,400 | $276,400 |
| 2022 | $6,848 | $516,800 | $240,400 | $276,400 |
| 2021 | $6,796 | $495,000 | $218,600 | $276,400 |
| 2020 | $6,370 | $398,900 | $191,600 | $207,300 |
| 2019 | $6,283 | $398,900 | $191,600 | $207,300 |
| 2018 | $6,292 | $387,200 | $179,900 | $207,300 |
| 2017 | $5,805 | $357,200 | $149,900 | $207,300 |
| 2016 | $5,283 | $357,200 | $149,900 | $207,300 |
| 2015 | $4,683 | $316,600 | $141,100 | $175,500 |
| 2014 | $4,786 | $313,400 | $141,100 | $172,300 |
| 2013 | $5,427 | $355,400 | $141,100 | $214,300 |
Source: Public Records
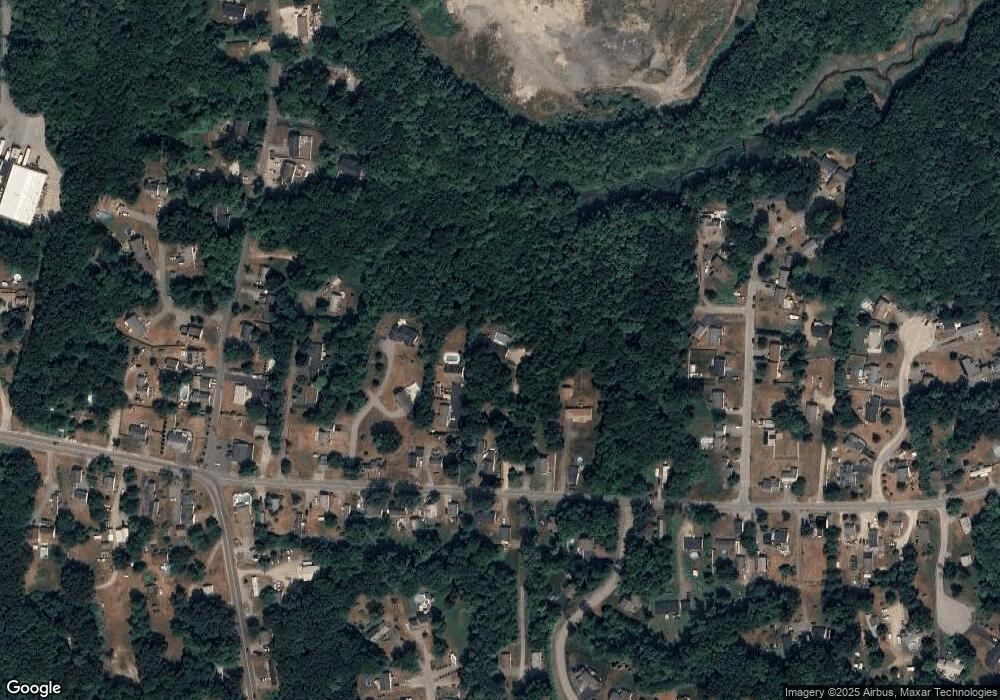
Map
Nearby Homes
- 22 Farm Ln
- 20 Railroad Ave
- 38 Rocks Rd Unit 1
- 1 Marshall Way
- 124 Whip-Poor-will St
- 27 Stacey Ave
- 19 Fowlers Ct
- 22 Robert Rd
- 96 Folly Mill Rd
- 95 Lillian Ave
- 241 & 245 Lafayette Rd
- 84 S Main St
- 2 Collins St
- 207 S Main St
- 27 Cross Beach Rd
- 46 Kensington Rd
- 51 Depot Rd
- 18 River St
- 312 S Main St
- 308 Route 286 Unit 77