

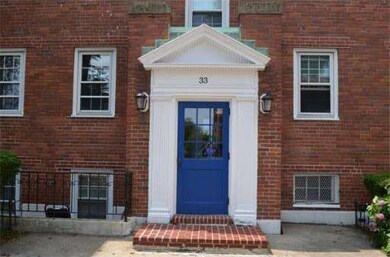
33 Lennon Ct Unit 42 Boston, MA 02127
South Boston Neighborhood
2
Beds
1
Bath
713
Sq Ft
871
Sq Ft Lot
About This Home
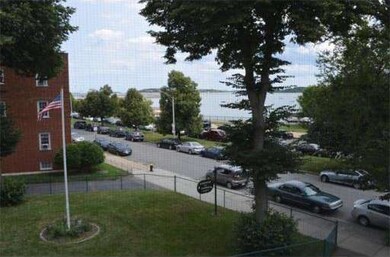
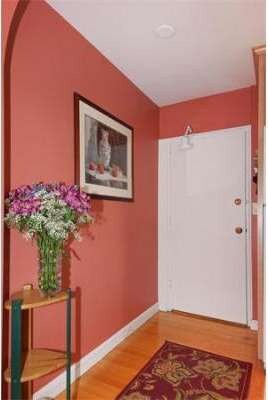
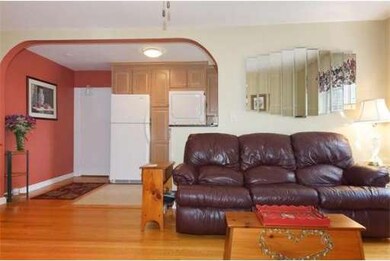
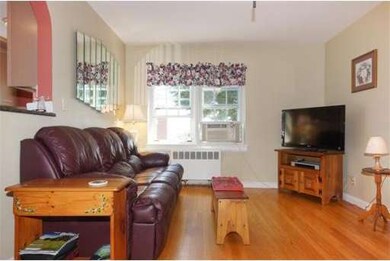
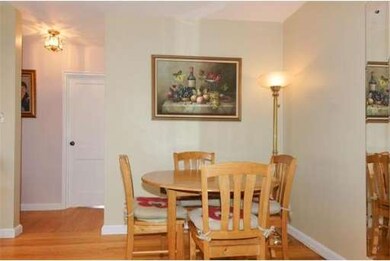
As of November 2017Upper level unit across from the yacht club and the causeway to Castle island! Water views from every window. This 2 bedroom unit has been tastefully renovated and includes in-unit laundry, lots of storage and hardwood floors throughout. Can be delivered furnished. An exceptional unit!
Ownership History
Date
Name
Owned For
Owner Type
Purchase Details
Listed on
Sep 19, 2017
Closed on
Nov 15, 2017
Sold by
Macdougall Bruce
Bought by
Bahhady Imad
Seller's Agent
Joyce Lebedew
Joyce Lebedew Real Estate
Buyer's Agent
Rich Dolabany
Boston Heritage Realty, LLC
List Price
$449,000
Sold Price
$435,000
Premium/Discount to List
-$14,000
-3.12%
Current Estimated Value
Home Financials for this Owner
Home Financials are based on the most recent Mortgage that was taken out on this home.
Estimated Appreciation
$175,364
Avg. Annual Appreciation
4.69%
Original Mortgage
$304,500
Outstanding Balance
$258,172
Interest Rate
3.85%
Mortgage Type
New Conventional
Estimated Equity
$358,300
Purchase Details
Listed on
Jul 30, 2014
Closed on
Apr 24, 2015
Sold by
Bacchi Joseph and Bacchi Susan
Bought by
Macdonougal Bruce
Seller's Agent
Jackie Rooney
Rooney Real Estate, LLC
Buyer's Agent
Lizete Alcalai
RE/MAX Beacon
List Price
$384,000
Sold Price
$376,000
Premium/Discount to List
-$8,000
-2.08%
Home Financials for this Owner
Home Financials are based on the most recent Mortgage that was taken out on this home.
Avg. Annual Appreciation
5.86%
Purchase Details
Closed on
Aug 3, 1998
Sold by
Connolly George M and Connolly Margaret M
Bought by
Bacchi Joseph and Bacchi Susan
Purchase Details
Closed on
Jul 19, 1989
Sold by
Crowley Eileen G
Bought by
Connolly George M
Home Financials for this Owner
Home Financials are based on the most recent Mortgage that was taken out on this home.
Original Mortgage
$120,000
Interest Rate
10.07%
Mortgage Type
Purchase Money Mortgage
Similar Homes in the area
Create a Home Valuation Report for This Property
The Home Valuation Report is an in-depth analysis detailing your home's value as well as a comparison with similar homes in the area
Home Values in the Area
Average Home Value in this Area
Purchase History
| Date | Type | Sale Price | Title Company |
|---|---|---|---|
| Not Resolvable | $435,000 | -- | |
| Not Resolvable | $376,000 | -- | |
| Warranty Deed | $122,800 | -- | |
| Warranty Deed | $150,000 | -- |
Source: Public Records
Mortgage History
| Date | Status | Loan Amount | Loan Type |
|---|---|---|---|
| Open | $304,500 | New Conventional | |
| Previous Owner | $120,000 | Purchase Money Mortgage |
Source: Public Records
Property History
| Date | Event | Price | Change | Sq Ft Price |
|---|---|---|---|---|
| 09/01/2020 09/01/20 | Rented | $2,200 | 0.0% | -- |
| 08/14/2020 08/14/20 | Under Contract | -- | -- | -- |
| 07/27/2020 07/27/20 | Price Changed | $2,200 | -17.0% | $3 / Sq Ft |
| 07/21/2020 07/21/20 | For Rent | $2,650 | 0.0% | -- |
| 11/15/2017 11/15/17 | Sold | $435,000 | -3.1% | $610 / Sq Ft |
| 10/03/2017 10/03/17 | Pending | -- | -- | -- |
| 09/19/2017 09/19/17 | For Sale | $449,000 | 0.0% | $630 / Sq Ft |
| 09/01/2017 09/01/17 | Rented | $2,500 | -3.8% | -- |
| 06/22/2017 06/22/17 | Under Contract | -- | -- | -- |
| 06/19/2017 06/19/17 | Price Changed | $2,600 | -3.7% | $4 / Sq Ft |
| 06/05/2017 06/05/17 | For Rent | $2,700 | 0.0% | -- |
| 04/24/2015 04/24/15 | Sold | $376,000 | 0.0% | $527 / Sq Ft |
| 04/23/2015 04/23/15 | Rented | $2,400 | -4.0% | -- |
| 04/23/2015 04/23/15 | For Rent | $2,500 | 0.0% | -- |
| 03/16/2015 03/16/15 | Off Market | $376,000 | -- | -- |
| 03/02/2015 03/02/15 | For Sale | $384,000 | +2.1% | $539 / Sq Ft |
| 02/28/2015 02/28/15 | Off Market | $376,000 | -- | -- |
| 11/17/2014 11/17/14 | Price Changed | $384,000 | 0.0% | $539 / Sq Ft |
| 11/17/2014 11/17/14 | For Sale | $384,000 | +2.1% | $539 / Sq Ft |
| 10/21/2014 10/21/14 | Off Market | $376,000 | -- | -- |
| 07/30/2014 07/30/14 | For Sale | $389,000 | -- | $546 / Sq Ft |
Source: MLS Property Information Network (MLS PIN)
Tax History Compared to Growth
Tax History
| Year | Tax Paid | Tax Assessment Tax Assessment Total Assessment is a certain percentage of the fair market value that is determined by local assessors to be the total taxable value of land and additions on the property. | Land | Improvement |
|---|---|---|---|---|
| 2025 | $6,246 | $539,400 | $0 | $539,400 |
| 2024 | $5,749 | $527,400 | $0 | $527,400 |
| 2023 | $5,549 | $516,700 | $0 | $516,700 |
| 2022 | $5,404 | $496,700 | $0 | $496,700 |
| 2021 | $5,158 | $483,400 | $0 | $483,400 |
| 2020 | $4,425 | $419,000 | $0 | $419,000 |
| 2019 | $4,123 | $391,200 | $0 | $391,200 |
| 2018 | $3,904 | $372,500 | $0 | $372,500 |
| 2017 | $3,687 | $348,200 | $0 | $348,200 |
| 2016 | $3,805 | $345,900 | $0 | $345,900 |
| 2015 | $3,978 | $328,500 | $0 | $328,500 |
| 2014 | $3,690 | $293,300 | $0 | $293,300 |
Source: Public Records
Agents Affiliated with this Home
-
Michael Peerless
Seller's Agent in 2020
Michael Peerless
Boston Heritage Realty, LLC
(860) 919-0602
10 Total Sales
-
Buyer's Agent in 2020
Graham Parker
Parker & Co Real Estate Group
(617) 981-1500
-
Seller's Agent in 2017
Joyce Lebedew
Joyce Lebedew Real Estate
(617) 594-1449
-
Jack Staley
Seller's Agent in 2017
Jack Staley
Joyce Lebedew Real Estate
(617) 999-0597
10 in this area
11 Total Sales
-
Rich Dolabany
Buyer's Agent in 2017
Rich Dolabany
Boston Heritage Realty, LLC
(617) 538-2650
1 in this area
30 Total Sales
-
Melissa McColgan
Buyer's Agent in 2017
Melissa McColgan
Grove Property Group
(617) 596-1106
1 in this area
5 Total Sales
Map
Source: MLS Property Information Network (MLS PIN)
MLS Number: 71721752
APN: SBOS-000000-000006-004420-000084
Disclaimer: Certain information contained herein is derived from information provided by parties other than Homes.com. All information provided is deemed reliable, but is not guaranteed to be accurate and should be independently verified.
![]() The property listing data and information, or the Images, set forth herein were provided to MLS Property Information Network, Inc. from third party sources, including sellers, lessors and public records, and were compiled by MLS Property Information Network, Inc. The property listing data and information, and the Images, are for the personal, non-commercial use of consumers having a good faith interest in purchasing or leasing listed properties of the type displayed to them and may not be used for any purpose other than to identify prospective properties which such consumers may have a good faith interest in purchasing or leasing. MLS Property Information Network, Inc. and its subscribers disclaim any and all representations and warranties as to the accuracy of the property listing data and information, or as to the accuracy of any of the Images, set forth herein.
The property listing data and information, or the Images, set forth herein were provided to MLS Property Information Network, Inc. from third party sources, including sellers, lessors and public records, and were compiled by MLS Property Information Network, Inc. The property listing data and information, and the Images, are for the personal, non-commercial use of consumers having a good faith interest in purchasing or leasing listed properties of the type displayed to them and may not be used for any purpose other than to identify prospective properties which such consumers may have a good faith interest in purchasing or leasing. MLS Property Information Network, Inc. and its subscribers disclaim any and all representations and warranties as to the accuracy of the property listing data and information, or as to the accuracy of any of the Images, set forth herein.
Nearby Homes
- 823 E 6th St Unit 5
- 821 E 6th St Unit 1
- 815 E 5th St Unit 9
- 866 E 6th St Unit 1
- 786 E 6th St Unit 788
- 828-834 E 5th St Unit 4
- 9 Twomey Ct Unit 52
- 124 O St Unit 2
- 110 O St Unit 1
- 915 E 4th St
- 873 E 4th St Unit 3
- 925 E 4th St
- 758 E 6th St Unit B
- 870 E 4th St Unit 1
- 17 Swallow St
- 15-17 Swallow St Unit 2
- 901 E Broadway Unit 1
- 933 E Broadway
- 734 E 6th St Unit 2
- 929 E Broadway Unit 2