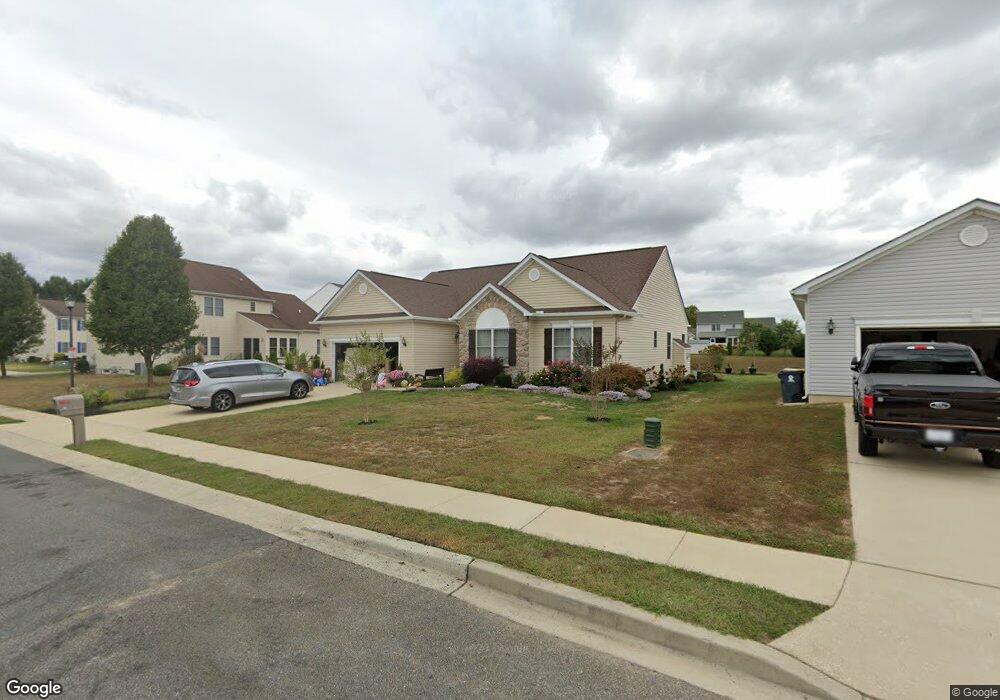
33 Nugent Loop Smyrna, DE 19977
Estimated Value: $381,626 - $406,000
3
Beds
3
Baths
1,852
Sq Ft
$214/Sq Ft
Est. Value
About This Home
This home is located at 33 Nugent Loop, Smyrna, DE 19977 and is currently estimated at $396,157, approximately $213 per square foot. 33 Nugent Loop is a home located in Kent County with nearby schools including Clayton Elementary School, John Bassett Moore Intermediate School, and Smyrna Middle School.
Ownership History
Date
Name
Owned For
Owner Type
Purchase Details
Closed on
Nov 30, 2005
Sold by
Town And Country Farm Llc
Bought by
White Carisa Lynn and Forrest Isaac
Current Estimated Value
Home Financials for this Owner
Home Financials are based on the most recent Mortgage that was taken out on this home.
Original Mortgage
$236,547
Outstanding Balance
$128,068
Interest Rate
5.75%
Mortgage Type
Adjustable Rate Mortgage/ARM
Estimated Equity
$268,089
Create a Home Valuation Report for This Property
The Home Valuation Report is an in-depth analysis detailing your home's value as well as a comparison with similar homes in the area
Home Values in the Area
Average Home Value in this Area
Purchase History
| Date | Buyer | Sale Price | Title Company |
|---|---|---|---|
| White Carisa Lynn | $262,830 | None Available |
Source: Public Records
Mortgage History
| Date | Status | Borrower | Loan Amount |
|---|---|---|---|
| Open | White Carisa Lynn | $236,547 |
Source: Public Records
Tax History
| Year | Tax Paid | Tax Assessment Tax Assessment Total Assessment is a certain percentage of the fair market value that is determined by local assessors to be the total taxable value of land and additions on the property. | Land | Improvement |
|---|---|---|---|---|
| 2025 | $1,626 | $387,800 | $64,000 | $323,800 |
| 2024 | $1,636 | $387,800 | $64,000 | $323,800 |
| 2023 | $1,671 | $62,900 | $10,300 | $52,600 |
| 2022 | $1,614 | $62,900 | $10,300 | $52,600 |
| 2021 | $1,583 | $62,900 | $10,300 | $52,600 |
| 2020 | $1,385 | $62,900 | $10,300 | $52,600 |
| 2019 | $1,292 | $58,100 | $10,300 | $47,800 |
| 2018 | $1,292 | $58,100 | $10,300 | $47,800 |
| 2017 | $1,288 | $58,100 | $0 | $0 |
| 2016 | $1,307 | $58,100 | $0 | $0 |
| 2015 | $1,312 | $58,100 | $0 | $0 |
| 2014 | $1,228 | $58,100 | $0 | $0 |
Source: Public Records
Map
Nearby Homes
Your Personal Tour Guide
Ask me questions while you tour the home.