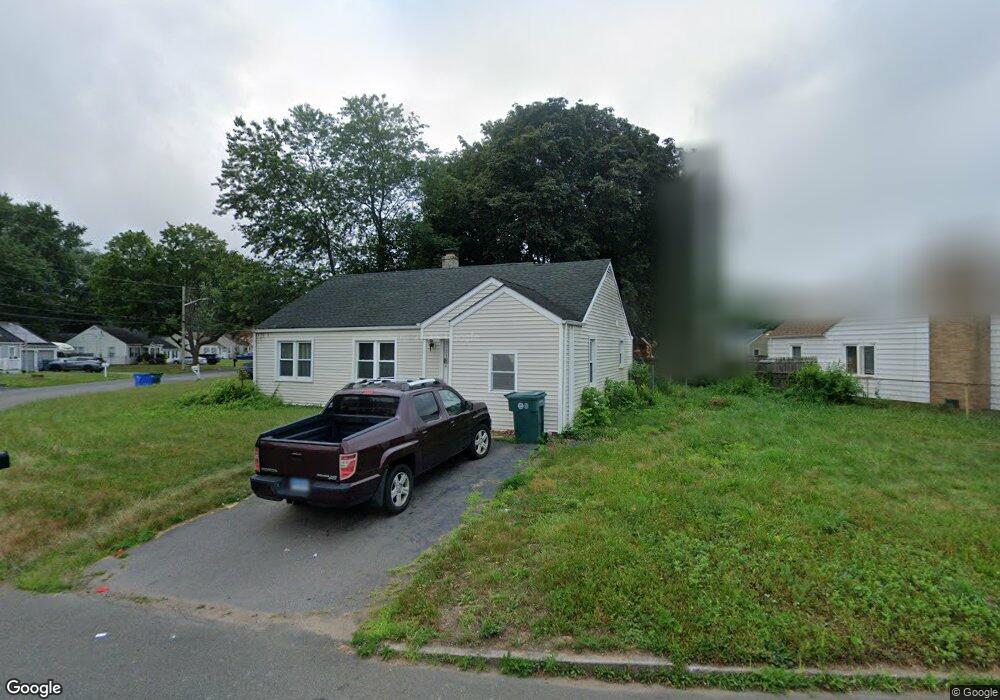
33 Piper Rd Hamden, CT 06514
Estimated Value: $315,605 - $412,000
3
Beds
1
Bath
1,337
Sq Ft
$272/Sq Ft
Est. Value
About This Home
This home is located at 33 Piper Rd, Hamden, CT 06514 and is currently estimated at $364,151, approximately $272 per square foot. 33 Piper Rd is a home located in New Haven County with nearby schools including Church Street School, Hamden Middle School, and Hamden High School.
Ownership History
Date
Name
Owned For
Owner Type
Purchase Details
Closed on
Dec 1, 2011
Sold by
Alves Alaerte C
Bought by
Visconti Stephen
Current Estimated Value
Home Financials for this Owner
Home Financials are based on the most recent Mortgage that was taken out on this home.
Original Mortgage
$170,563
Outstanding Balance
$117,591
Interest Rate
4.25%
Mortgage Type
FHA
Estimated Equity
$246,560
Purchase Details
Closed on
Jan 10, 2011
Sold by
Bank Of New York
Bought by
Alves Alaerte C
Purchase Details
Closed on
Sep 15, 2010
Sold by
Casey Todd
Bought by
Bank Of New York
Purchase Details
Closed on
Jan 11, 2007
Sold by
Desanto-Belenchia Beth
Bought by
Casey Todd
Home Financials for this Owner
Home Financials are based on the most recent Mortgage that was taken out on this home.
Original Mortgage
$145,000
Interest Rate
6.18%
Purchase Details
Closed on
Mar 22, 2002
Sold by
Logan David
Bought by
Allen Tula
Create a Home Valuation Report for This Property
The Home Valuation Report is an in-depth analysis detailing your home's value as well as a comparison with similar homes in the area
Home Values in the Area
Average Home Value in this Area
Purchase History
| Date | Buyer | Sale Price | Title Company |
|---|---|---|---|
| Visconti Stephen | $175,000 | -- | |
| Alves Alaerte C | $93,000 | -- | |
| Bank Of New York | -- | -- | |
| Casey Todd | $181,250 | -- | |
| Allen Tula | $75,000 | -- |
Source: Public Records
Mortgage History
| Date | Status | Borrower | Loan Amount |
|---|---|---|---|
| Open | Allen Tula | $170,563 | |
| Previous Owner | Allen Tula | $145,000 | |
| Previous Owner | Allen Tula | $15,000 |
Source: Public Records
Tax History
| Year | Tax Paid | Tax Assessment Tax Assessment Total Assessment is a certain percentage of the fair market value that is determined by local assessors to be the total taxable value of land and additions on the property. | Land | Improvement |
|---|---|---|---|---|
| 2025 | $10,978 | $211,610 | $56,560 | $155,050 |
| 2024 | $7,143 | $128,450 | $31,360 | $97,090 |
| 2023 | $7,234 | $128,310 | $31,360 | $96,950 |
| 2022 | $7,119 | $128,310 | $31,360 | $96,950 |
| 2021 | $6,729 | $128,310 | $31,360 | $96,950 |
| 2020 | $5,036 | $96,880 | $41,790 | $55,090 |
| 2019 | $4,734 | $96,880 | $41,790 | $55,090 |
| 2018 | $4,646 | $96,880 | $41,790 | $55,090 |
| 2017 | $4,385 | $96,880 | $41,790 | $55,090 |
| 2016 | $4,394 | $96,880 | $41,790 | $55,090 |
| 2015 | $4,763 | $116,550 | $52,220 | $64,330 |
| 2014 | $4,654 | $116,550 | $52,220 | $64,330 |
Source: Public Records
Map
Nearby Homes
Your Personal Tour Guide
Ask me questions while you tour the home.