Estimated Value: $435,012 - $461,000
2
Beds
2
Baths
1,074
Sq Ft
$414/Sq Ft
Est. Value
About This Home
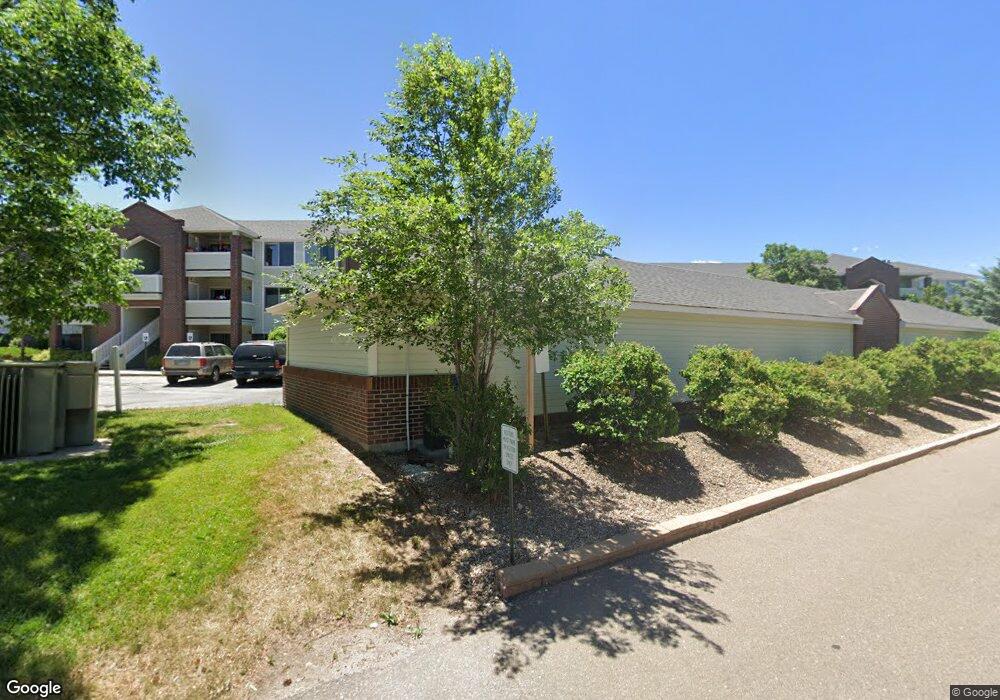
This home is located at 33 S Boulder Cir Unit 102, Boulder, CO 80303 and is currently estimated at $444,753, approximately $414 per square foot. 33 S Boulder Cir Unit 102 is a home located in Boulder County with nearby schools including Eisenhower Elementary School, Manhattan Middle School of the Arts & Academics, and Fairview High School.
Ownership History
Date
Name
Owned For
Owner Type
Purchase Details
Closed on
Dec 13, 2023
Sold by
Sprague Cheryl E
Bought by
Cheryl Sprague Living Trust and Sprague
Current Estimated Value
Purchase Details
Closed on
Jan 10, 1994
Sold by
Trautwein Cindy and Trautwein Jerry
Bought by
Sprague Cheryl E
Home Financials for this Owner
Home Financials are based on the most recent Mortgage that was taken out on this home.
Original Mortgage
$96,000
Interest Rate
7.23%
Purchase Details
Closed on
Dec 15, 1993
Sold by
South Boulder Circle Llc
Bought by
Trautwein Cindy
Home Financials for this Owner
Home Financials are based on the most recent Mortgage that was taken out on this home.
Original Mortgage
$96,000
Interest Rate
7.23%
Create a Home Valuation Report for This Property
The Home Valuation Report is an in-depth analysis detailing your home's value as well as a comparison with similar homes in the area
Home Values in the Area
Average Home Value in this Area
Purchase History
| Date | Buyer | Sale Price | Title Company |
|---|---|---|---|
| Cheryl Sprague Living Trust | -- | None Listed On Document | |
| Sprague Cheryl E | $120,000 | -- | |
| Trautwein Cindy | $113,500 | First American Heritage Titl |
Source: Public Records
Mortgage History
| Date | Status | Borrower | Loan Amount |
|---|---|---|---|
| Previous Owner | Sprague Cheryl E | $96,000 |
Source: Public Records
Tax History Compared to Growth
Tax History
| Year | Tax Paid | Tax Assessment Tax Assessment Total Assessment is a certain percentage of the fair market value that is determined by local assessors to be the total taxable value of land and additions on the property. | Land | Improvement |
|---|---|---|---|---|
| 2025 | $1,973 | $29,881 | -- | $29,881 |
| 2024 | $1,973 | $29,881 | -- | $29,881 |
| 2023 | $1,939 | $29,149 | -- | $32,834 |
| 2022 | $2,166 | $30,274 | $0 | $30,274 |
| 2021 | $2,065 | $31,145 | $0 | $31,145 |
| 2020 | $1,916 | $29,158 | $0 | $29,158 |
| 2019 | $1,886 | $29,158 | $0 | $29,158 |
| 2018 | $1,509 | $24,610 | $0 | $24,610 |
| 2017 | $1,462 | $27,207 | $0 | $27,207 |
| 2016 | $1,003 | $19,550 | $0 | $19,550 |
| 2015 | $950 | $16,796 | $0 | $16,796 |
| 2014 | $760 | $16,796 | $0 | $16,796 |
Source: Public Records
About This Building
Map
Nearby Homes
- 20 S Boulder Cir Unit 2312
- 20 S Boulder Cir Unit 2314
- 20 S Boulder Cir Unit 2109
- 33 S Boulder Cir Unit 306
- 4763 Tantra Dr Unit B
- 750 W Moorhead Cir Unit A
- 860 W Moorhead Cir Unit I
- 860 W Moorhead Cir Unit 2K
- 860 W Moorhead Cir Unit 2H
- 611 Tantra Dr
- 800 W Moorhead Cir Unit E
- 850 W Moorhead Cir Unit 3L
- 4255 Apache Rd
- 4733 W Moorhead Cir
- 4814 W Moorhead Cir
- 500 Manhattan Dr Unit B1
- 1019 Tantra Park Cir
- 500 Mohawk Dr Unit 510
- 625 Manhattan Place Unit 308
- 725 S 45th St
- 33 S Boulder Cir Unit 322
- 33 S Boulder Cir Unit 321
- 33 S Boulder Cir Unit 304
- 33 S Boulder Cir Unit 303
- 33 S Boulder Cir Unit 302
- 33 S Boulder Cir Unit 301
- 33 S Boulder Cir Unit 222
- 33 S Boulder Cir Unit 221
- 33 S Boulder Cir Unit 204
- 33 S Boulder Cir Unit 203
- 33 S Boulder Cir Unit 202
- 33 S Boulder Cir Unit 201
- 33 S Boulder Cir Unit 121
- 33 S Boulder Cir Unit 104
- 33 S Boulder Cir Unit 103
- 33 S Boulder Cir Unit 101
- 33 S Boulder Cir Unit 312
- 33 S Boulder Cir Unit 311
- 33 S Boulder Cir Unit 310
- 33 S Boulder Cir Unit 309