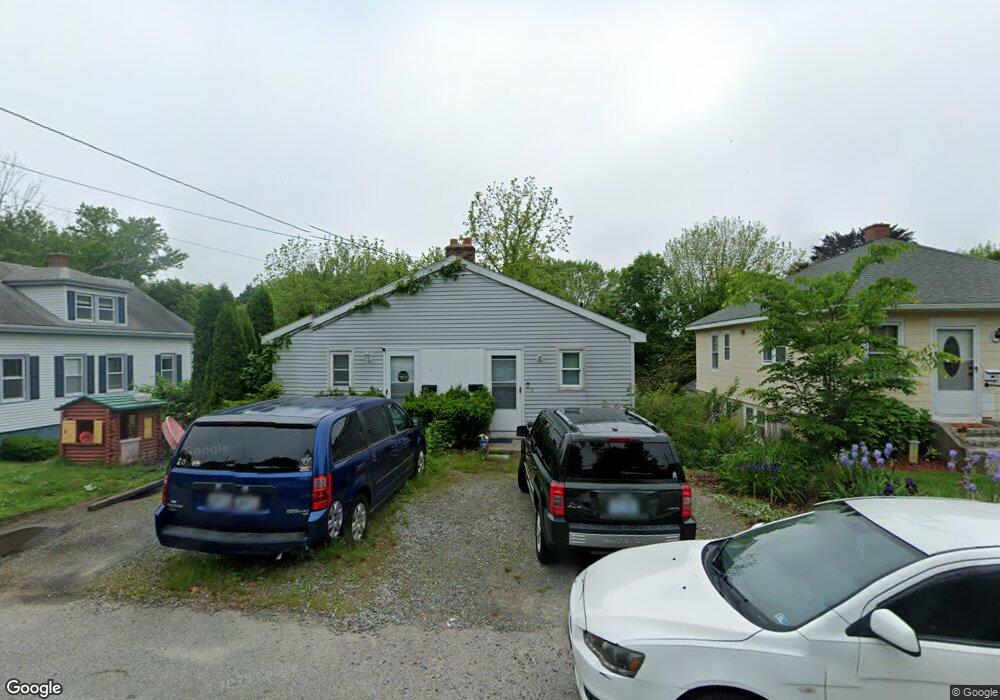
33 Spring St Westerly, RI 02891
Estimated Value: $413,051 - $482,000
4
Beds
2
Baths
1,740
Sq Ft
$255/Sq Ft
Est. Value
About This Home
This home is located at 33 Spring St, Westerly, RI 02891 and is currently estimated at $444,263, approximately $255 per square foot. 33 Spring St is a home located in Washington County with nearby schools including Westerly High School and St. Michael School.
Ownership History
Date
Name
Owned For
Owner Type
Purchase Details
Closed on
Apr 29, 2005
Sold by
Purcell Edward
Bought by
Dugas Brandon and Reed Jennifer
Current Estimated Value
Home Financials for this Owner
Home Financials are based on the most recent Mortgage that was taken out on this home.
Original Mortgage
$237,500
Outstanding Balance
$123,910
Interest Rate
5.95%
Mortgage Type
Purchase Money Mortgage
Estimated Equity
$320,353
Purchase Details
Closed on
May 1, 1998
Sold by
Williams Nelson T and Hanley Jeffrey T
Bought by
Purcell Edward S
Home Financials for this Owner
Home Financials are based on the most recent Mortgage that was taken out on this home.
Original Mortgage
$77,600
Interest Rate
7.04%
Create a Home Valuation Report for This Property
The Home Valuation Report is an in-depth analysis detailing your home's value as well as a comparison with similar homes in the area
Home Values in the Area
Average Home Value in this Area
Purchase History
| Date | Buyer | Sale Price | Title Company |
|---|---|---|---|
| Dugas Brandon | $250,000 | -- | |
| Purcell Edward S | $97,000 | -- |
Source: Public Records
Mortgage History
| Date | Status | Borrower | Loan Amount |
|---|---|---|---|
| Open | Purcell Edward S | $237,500 | |
| Previous Owner | Purcell Edward S | $76,000 | |
| Previous Owner | Purcell Edward S | $77,600 |
Source: Public Records
Tax History Compared to Growth
Tax History
| Year | Tax Paid | Tax Assessment Tax Assessment Total Assessment is a certain percentage of the fair market value that is determined by local assessors to be the total taxable value of land and additions on the property. | Land | Improvement |
|---|---|---|---|---|
| 2025 | $2,445 | $314,300 | $144,400 | $169,900 |
| 2024 | $2,392 | $228,900 | $103,200 | $125,700 |
| 2023 | $2,326 | $228,900 | $103,200 | $125,700 |
| 2022 | $2,312 | $228,900 | $103,200 | $125,700 |
| 2021 | $2,355 | $195,300 | $89,800 | $105,500 |
| 2020 | $2,314 | $195,300 | $89,800 | $105,500 |
| 2019 | $2,293 | $195,300 | $89,800 | $105,500 |
| 2018 | $2,269 | $183,700 | $89,800 | $93,900 |
| 2017 | $2,204 | $183,700 | $89,800 | $93,900 |
| 2016 | $2,204 | $183,700 | $89,800 | $93,900 |
| 2015 | $2,112 | $188,100 | $91,600 | $96,500 |
| 2014 | $2,079 | $188,100 | $91,600 | $96,500 |
Source: Public Records
Map
Nearby Homes
- 24 George St
- 44 George St
- 25 School St Unit 2
- 57 School St
- 65 Mechanic St
- 38 Prospect St
- 52 Prospect St Unit B
- 16 Boiling Spring Ave
- 13 Palmer St
- 27 Liberty St
- 23 Abbey Ln Unit 12
- 24 Abbey Ln Unit 13
- 2 Pawcatuck Ave
- 145 High St Unit D
- 140 High St Unit 307
- 19 Pleasant St
- 12 Avery St
- 11 Apache Dr Unit D
- 17 Apache Dr Unit G
- 19 Apache Dr Unit F