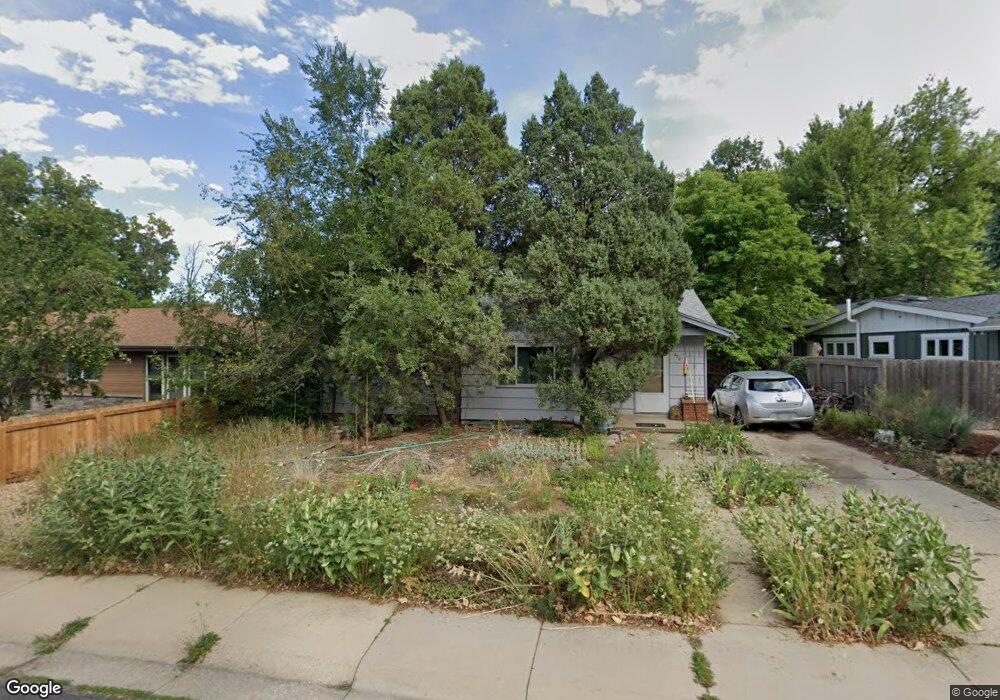
330 30th St Boulder, CO 80305
South Boulder NeighborhoodEstimated Value: $678,134 - $769,000
3
Beds
1
Bath
990
Sq Ft
$732/Sq Ft
Est. Value
About This Home
This home is located at 330 30th St, Boulder, CO 80305 and is currently estimated at $725,034, approximately $732 per square foot. 330 30th St is a home located in Boulder County with nearby schools including Creekside Elementary School, Manhattan Middle School of the Arts & Academics, and Fairview High School.
Ownership History
Date
Name
Owned For
Owner Type
Purchase Details
Closed on
Feb 27, 2006
Sold by
Henderson Chester Eugene and Henderson Diane K
Bought by
Oatmeal Investments Llc
Current Estimated Value
Purchase Details
Closed on
Apr 26, 2001
Sold by
Henderson Diane K and Henderson Chester Eugene
Bought by
Henderson Diane K and Henderson Chester Eugene
Purchase Details
Closed on
Aug 20, 1998
Sold by
Vaisberg Elena and Vaisberg Eugeni
Bought by
Henderson Diane K and Henderson Chester Eugene
Home Financials for this Owner
Home Financials are based on the most recent Mortgage that was taken out on this home.
Original Mortgage
$92,000
Interest Rate
6.9%
Mortgage Type
Stand Alone First
Purchase Details
Closed on
Mar 22, 1994
Sold by
Rodriguez Elfa E
Bought by
Vaisberg Elena
Home Financials for this Owner
Home Financials are based on the most recent Mortgage that was taken out on this home.
Original Mortgage
$114,400
Interest Rate
4.37%
Purchase Details
Closed on
Nov 27, 1984
Bought by
Oatmeal Investments Llc
Create a Home Valuation Report for This Property
The Home Valuation Report is an in-depth analysis detailing your home's value as well as a comparison with similar homes in the area
Home Values in the Area
Average Home Value in this Area
Purchase History
| Date | Buyer | Sale Price | Title Company |
|---|---|---|---|
| Oatmeal Investments Llc | -- | None Available | |
| Henderson Diane K | -- | -- | |
| Henderson Diane K | $166,000 | -- | |
| Vaisberg Elena | $143,000 | -- | |
| Oatmeal Investments Llc | $77,900 | -- |
Source: Public Records
Mortgage History
| Date | Status | Borrower | Loan Amount |
|---|---|---|---|
| Previous Owner | Henderson Diane K | $92,000 | |
| Previous Owner | Vaisberg Elena | $114,400 |
Source: Public Records
Tax History
| Year | Tax Paid | Tax Assessment Tax Assessment Total Assessment is a certain percentage of the fair market value that is determined by local assessors to be the total taxable value of land and additions on the property. | Land | Improvement |
|---|---|---|---|---|
| 2025 | $3,918 | $41,900 | $26,856 | $15,044 |
| 2024 | $3,918 | $41,900 | $26,856 | $15,044 |
| 2023 | $3,850 | $44,582 | $31,597 | $16,670 |
| 2022 | $3,572 | $37,662 | $23,929 | $13,733 |
| 2021 | $3,410 | $38,745 | $24,617 | $14,128 |
| 2020 | $3,163 | $36,343 | $23,738 | $12,605 |
| 2019 | $3,115 | $36,343 | $23,738 | $12,605 |
| 2018 | $2,895 | $33,386 | $21,816 | $11,570 |
| 2017 | $2,804 | $36,911 | $24,119 | $12,792 |
| 2016 | $2,604 | $30,081 | $15,204 | $14,877 |
| 2015 | $2,466 | $25,043 | $12,816 | $12,227 |
| 2014 | $2,106 | $25,043 | $12,816 | $12,227 |
Source: Public Records
Map
Nearby Homes
- 805 29th St Unit 253
- 805 29th St Unit 157
- 805 29th St Unit 402
- 805 29th St Unit 404
- 2221 Columbine Ave
- 2850 Aurora Ave Unit 107
- 245 Fair Place
- 2800 Aurora Ave Unit 119
- 780 33rd St
- 2141 Baseline Rd Unit 18
- 3000 Dartmouth Ave
- 2032 Mariposa Ave
- 2030 Columbine Ave
- 370 20th St
- 3805 Martin Dr
- 810 37th St
- 2585 Kohler Dr
- 2955 Stanford Ave
- 905 36th St
- 3009 Madison Ave Unit L216
Your Personal Tour Guide
Ask me questions while you tour the home.