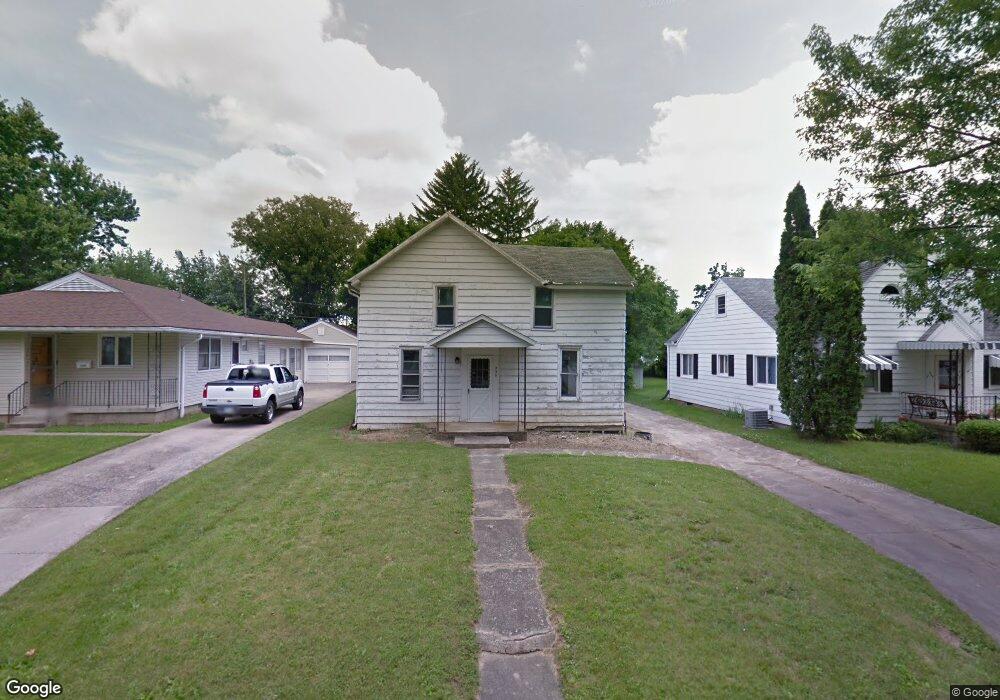
330 N Barron St Kenton, OH 43326
Estimated Value: $147,150 - $170,000
3
Beds
1
Bath
1,383
Sq Ft
$115/Sq Ft
Est. Value
About This Home
This home is located at 330 N Barron St, Kenton, OH 43326 and is currently estimated at $158,538, approximately $114 per square foot. 330 N Barron St is a home located in Hardin County with nearby schools including Kenton Elementary School, Kenton Middle School, and Kenton High School.
Ownership History
Date
Name
Owned For
Owner Type
Purchase Details
Closed on
Oct 3, 2022
Sold by
Manns Michael Edison and Manns Tammy Sue
Bought by
Pearson David
Current Estimated Value
Purchase Details
Closed on
Sep 4, 2019
Sold by
Brooks Rentals Llc
Bought by
Manns Michael Edison and Manns Tammy Sue
Purchase Details
Closed on
Jan 11, 2016
Sold by
Cwb Rental Properties Llc
Bought by
Brooks Rentals Llc
Purchase Details
Closed on
Mar 21, 2011
Sold by
Fannie Mae
Bought by
Cwb Rental Properties Llc
Purchase Details
Closed on
Feb 4, 2011
Sold by
Szymanski Michael and Szymanski Michael R
Bought by
Federal National Mortgage Association
Purchase Details
Closed on
Jun 19, 2002
Bought by
Szymanski Michael
Purchase Details
Closed on
Aug 10, 1999
Bought by
Szymanski Janet
Create a Home Valuation Report for This Property
The Home Valuation Report is an in-depth analysis detailing your home's value as well as a comparison with similar homes in the area
Home Values in the Area
Average Home Value in this Area
Purchase History
| Date | Buyer | Sale Price | Title Company |
|---|---|---|---|
| Pearson David | $110,000 | -- | |
| Manns Michael Edison | $5,000 | None Available | |
| Brooks Rentals Llc | -- | None Available | |
| Cwb Rental Properties Llc | $9,000 | None Available | |
| Federal National Mortgage Association | $18,000 | None Available | |
| Szymanski Michael | $60,000 | -- | |
| Szymanski Janet | -- | -- |
Source: Public Records
Tax History Compared to Growth
Tax History
| Year | Tax Paid | Tax Assessment Tax Assessment Total Assessment is a certain percentage of the fair market value that is determined by local assessors to be the total taxable value of land and additions on the property. | Land | Improvement |
|---|---|---|---|---|
| 2024 | $1,858 | $42,790 | $2,310 | $40,480 |
| 2023 | $1,858 | $42,790 | $2,310 | $40,480 |
| 2022 | $847 | $17,690 | $1,730 | $15,960 |
| 2021 | $850 | $17,690 | $1,730 | $15,960 |
| 2020 | $741 | $17,690 | $1,730 | $15,960 |
| 2019 | $507 | $10,070 | $1,650 | $8,420 |
| 2018 | $529 | $10,070 | $1,650 | $8,420 |
| 2017 | $464 | $10,070 | $1,650 | $8,420 |
| 2016 | $404 | $10,340 | $2,330 | $8,010 |
| 2015 | $383 | $10,340 | $2,330 | $8,010 |
| 2014 | $403 | $10,340 | $2,330 | $8,010 |
| 2013 | $437 | $10,810 | $2,330 | $8,480 |
Source: Public Records
Map
Nearby Homes
- 509 E Carrol St
- 0 N Barron St
- 503 Jennings St
- 416 N Cherry St
- 39 Grape St
- 416 E Eliza St
- 513 E Franklin St
- 79 Broadway St
- 530 E Franklin St
- 233 N Main St
- 215 N Main St
- 1 C Ct
- 121 S High St
- 328 N Detroit St
- 0 Gilmore St
- 104 Oak Ln Unit 15
- 310 N Market St
- 219 W Carrol St
- 115 Scioto St
- 324 Stone Hedge Ln Unit 324