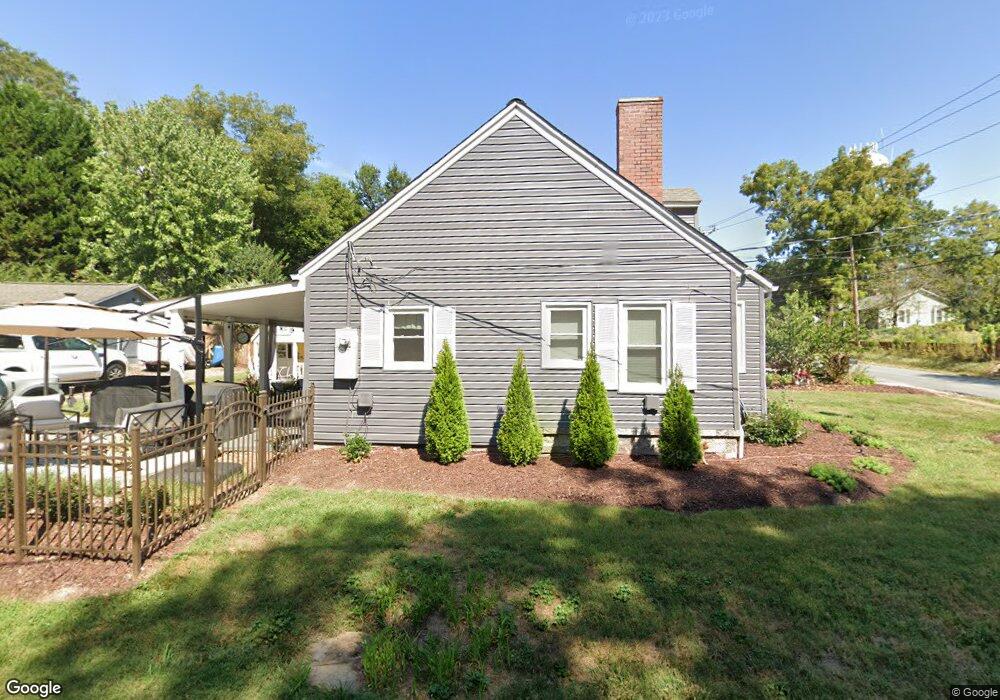
330 S Grove St Lincolnton, NC 28092
Estimated Value: $192,038 - $214,000
3
Beds
1
Bath
1,422
Sq Ft
$145/Sq Ft
Est. Value
About This Home
This home is located at 330 S Grove St, Lincolnton, NC 28092 and is currently estimated at $206,760, approximately $145 per square foot. 330 S Grove St is a home located in Lincoln County with nearby schools including S. Ray Lowder Elementary School, Lincolnton Middle School, and Lincolnton High School.
Ownership History
Date
Name
Owned For
Owner Type
Purchase Details
Closed on
Dec 5, 2016
Sold by
Propst Millie Lawing and Propst Perry Phillip
Bought by
Mabe Brittany
Current Estimated Value
Home Financials for this Owner
Home Financials are based on the most recent Mortgage that was taken out on this home.
Original Mortgage
$109,090
Outstanding Balance
$88,143
Interest Rate
3.54%
Mortgage Type
New Conventional
Estimated Equity
$118,617
Purchase Details
Closed on
Jun 1, 1992
Bought by
Caldwell Millie L
Create a Home Valuation Report for This Property
The Home Valuation Report is an in-depth analysis detailing your home's value as well as a comparison with similar homes in the area
Home Values in the Area
Average Home Value in this Area
Purchase History
| Date | Buyer | Sale Price | Title Company |
|---|---|---|---|
| Mabe Brittany | $108,000 | None Available | |
| Caldwell Millie L | $47,500 | -- |
Source: Public Records
Mortgage History
| Date | Status | Borrower | Loan Amount |
|---|---|---|---|
| Open | Mabe Brittany | $109,090 |
Source: Public Records
Tax History Compared to Growth
Tax History
| Year | Tax Paid | Tax Assessment Tax Assessment Total Assessment is a certain percentage of the fair market value that is determined by local assessors to be the total taxable value of land and additions on the property. | Land | Improvement |
|---|---|---|---|---|
| 2025 | $1,083 | $94,347 | $19,200 | $75,147 |
| 2024 | $1,063 | $94,347 | $19,200 | $75,147 |
| 2023 | $1,058 | $94,347 | $19,200 | $75,147 |
| 2022 | $996 | $74,706 | $15,000 | $59,706 |
| 2021 | $996 | $74,706 | $15,000 | $59,706 |
| 2020 | $866 | $74,706 | $15,000 | $59,706 |
| 2019 | $866 | $74,706 | $15,000 | $59,706 |
| 2018 | $845 | $63,559 | $14,000 | $49,559 |
| 2017 | $744 | $63,559 | $14,000 | $49,559 |
| 2016 | $744 | $63,559 | $14,000 | $49,559 |
| 2015 | $815 | $63,559 | $14,000 | $49,559 |
| 2014 | $1,026 | $81,451 | $15,000 | $66,451 |
Source: Public Records
Map
Nearby Homes
- 317 S High St
- 627 W Main St
- 665 S Grove St
- 681 S Grove St
- 411 W Sycamore St
- 689 S Grove St
- 697 S Grove St
- 515 Willow St
- 668 Riverside Dr
- 818 Grier St
- 327 Bonview Ave
- 502 Forney Ave
- 524 Bonview Ave
- 316 N Government St
- 515 S Academy St
- 535 Norman Fair Ave
- 329 E Congress St
- 916 E Park Dr
- 00 Glenn St
- 801 N Grove St