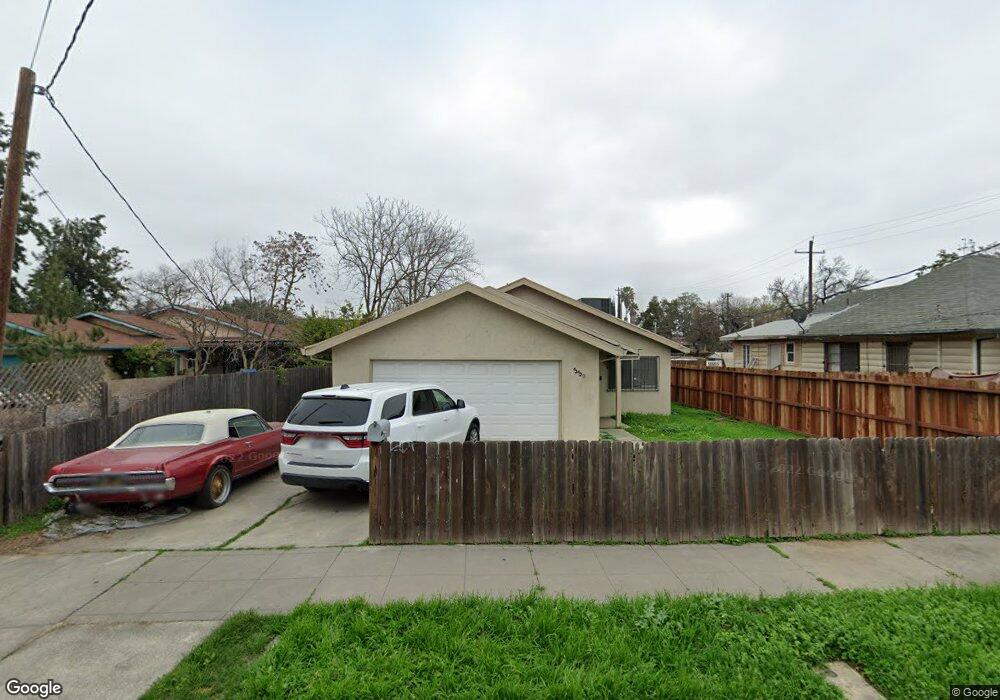
330 S San Jose St Stockton, CA 95203
Seaport NeighborhoodEstimated Value: $77,000 - $299,472
3
Beds
1
Bath
981
Sq Ft
$231/Sq Ft
Est. Value
About This Home
This home is located at 330 S San Jose St, Stockton, CA 95203 and is currently estimated at $226,368, approximately $230 per square foot. 330 S San Jose St is a home located in San Joaquin County with nearby schools including George Washington Elementary School, San Joaquin Elementary School, and John Marshall Elementary School.
Ownership History
Date
Name
Owned For
Owner Type
Purchase Details
Closed on
Oct 29, 2009
Sold by
Gann Jeremy and Gann Kimberly
Bought by
Jkg Investments Llc
Current Estimated Value
Purchase Details
Closed on
Oct 7, 2008
Sold by
U S Bank National Association
Bought by
Gann Jeremy and Gann Kimberly
Home Financials for this Owner
Home Financials are based on the most recent Mortgage that was taken out on this home.
Original Mortgage
$52,000
Interest Rate
5.9%
Mortgage Type
Purchase Money Mortgage
Purchase Details
Closed on
Mar 6, 2008
Sold by
Romero Jesus and Romero Maria
Bought by
U S Bank Na and Bnc Mortgage Loan Trust 2006-1
Purchase Details
Closed on
Apr 1, 2005
Sold by
Sanchez Jose De Jesus and Sanchez Elvira
Bought by
Romero Jesus and Romero Maria
Home Financials for this Owner
Home Financials are based on the most recent Mortgage that was taken out on this home.
Original Mortgage
$164,800
Interest Rate
6.1%
Mortgage Type
Fannie Mae Freddie Mac
Create a Home Valuation Report for This Property
The Home Valuation Report is an in-depth analysis detailing your home's value as well as a comparison with similar homes in the area
Home Values in the Area
Average Home Value in this Area
Purchase History
| Date | Buyer | Sale Price | Title Company |
|---|---|---|---|
| Jkg Investments Llc | -- | None Available | |
| Gann Jeremy | $65,000 | First American Title Company | |
| U S Bank Na | $235,000 | Accommodation | |
| Romero Jesus | $206,000 | Chicago Title Co |
Source: Public Records
Mortgage History
| Date | Status | Borrower | Loan Amount |
|---|---|---|---|
| Previous Owner | Gann Jeremy | $52,000 | |
| Previous Owner | Romero Jesus | $164,800 | |
| Closed | Romero Jesus | $41,200 |
Source: Public Records
Tax History Compared to Growth
Tax History
| Year | Tax Paid | Tax Assessment Tax Assessment Total Assessment is a certain percentage of the fair market value that is determined by local assessors to be the total taxable value of land and additions on the property. | Land | Improvement |
|---|---|---|---|---|
| 2025 | $1,193 | $83,692 | $32,188 | $51,504 |
| 2024 | $1,173 | $82,052 | $31,557 | $50,495 |
| 2023 | $1,146 | $80,444 | $30,939 | $49,505 |
| 2022 | $1,003 | $78,868 | $30,333 | $48,535 |
| 2021 | $964 | $77,323 | $29,739 | $47,584 |
| 2020 | $982 | $76,532 | $29,435 | $47,097 |
| 2019 | $979 | $75,032 | $28,858 | $46,174 |
| 2018 | $961 | $73,562 | $28,293 | $45,269 |
| 2017 | $911 | $72,121 | $27,739 | $44,382 |
| 2016 | $927 | $70,707 | $27,195 | $43,512 |
| 2014 | $883 | $68,281 | $26,262 | $42,019 |
Source: Public Records
Map
Nearby Homes
- 510- S Pershing Ave
- 519 W Scotts Ave
- 1661 W Hazelton Ave
- 1765 W Sonora St
- 348 S Los Angeles Ave
- 309 S Los Angeles Ave
- 20 S Los Angeles Ave
- 520 W Jackson St
- 525 W Fremont St
- 416 W Jackson St
- 727 N Stockton St
- 725 W Park St
- 715 W Park St
- 720 W Flora St
- 519 N Monroe St
- 826 N San Jose St
- 319 W Oak St
- 522-528 N Van Buren St
- 840 N Edison St
- 907 N Pershing Ave
- 352 S San Jose St
- 326 S San Jose St
- 905 W Sonora St
- 333 S Yosemite St
- 231 W Sonora St
- 341 S San Jose St
- 337 S San Jose St
- 333 S San Jose St
- 930 W Sonora St
- 404 S San Jose St
- 401 S Yosemite St
- 405 S San Jose St
- 411 S Yosemite St
- 422 S San Jose St
- 346 S Yosemite St
- 1014 W Sonora St
- 342 S Argonaut St
- 413 S Yosemite St
- 338 S Argonaut St
- 340 S Yosemite St